Isomesh
Appearance
isomesh creates a mesh isosurface object from a map object.
Usage
[edit]isomesh name, map, level [,(selection) [,buffer [,state [,carve ]]]]
- name = str: the name for the new mesh isosurface object.
- map = str: the name of the map object to use for computing the mesh.
- level = float: the contour level (in sigma units) {default: 1.0}
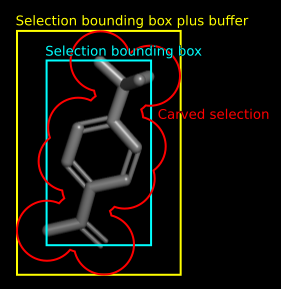
- selection = str: an atom selection about which to display the mesh with an additional "buffer" (if provided).
- buffer = float: (see selection)
- state = int: the state into which the object should be loaded (default=1) (set state=0 to append new mesh as a new state) {default: 1}
- carve = float: a radius about each atom in the selection for which to include density. If "carve" is not provided, then the whole brick is displayed.
Example
[edit]fetch 6sps
fetch 6sps, type=2fofc
# mesh for entire map object
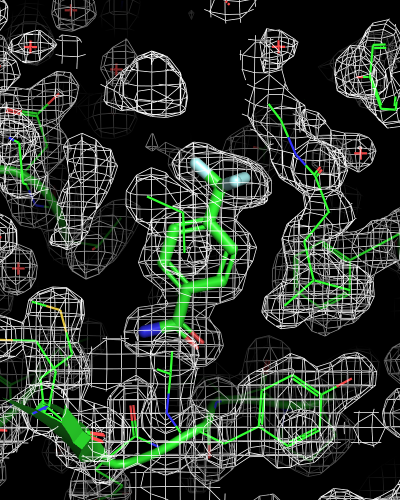
isomesh mesh_all, 6sps_2fofc
# mesh within bounding box of ligand, enlarged by 2 Angstrom
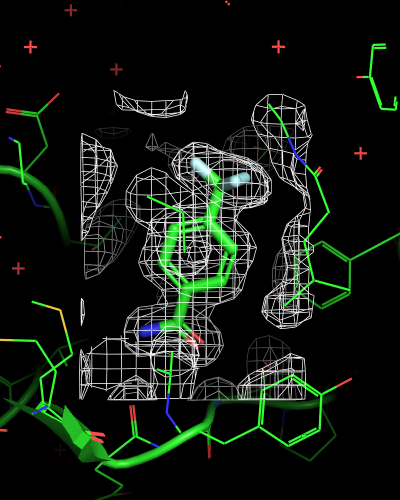
isomesh mesh_ligand, 6sps_2fofc, selection=(resn LR5), buffer=2
# mesh only within 2 Angstrom radius of any ligand atom
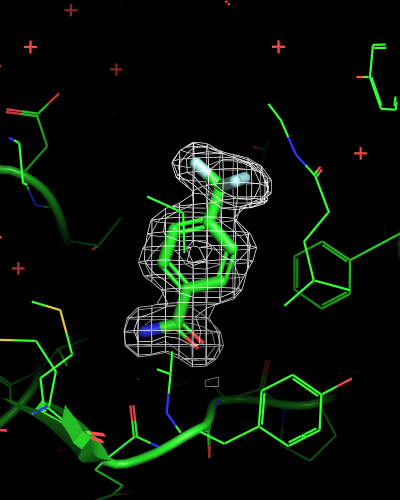
isomesh mesh_ligand_carved, 6sps_2fofc, selection=(resn LR5), carve=2
set_view (\
0.001600198, -0.993020296, 0.117938228,\
-0.999629617, 0.001603606, 0.027057989,\
-0.027055763, -0.117936097, -0.992654920,\
0.000000000, 0.000000000, -55.829845428,\
12.989342690, 2.425159931, 19.217729568,\
51.427371979, 60.232315063, -19.999994278 )
| mesh_all | mesh_ligand | mesh_ligand_carved |
|---|---|---|

|

|

|
Details
[edit]Selection Argument
[edit]The arguments selection, buffer and carve can limit the mesh display to a selected area, and/or extend the area by symmetry operators if the selection is located outside the map bounding box itself.
State Arguments
[edit]If the mesh object already exists, then the new mesh will be appended onto the object as a new state (unless you indicate a state).
- state > 0: specific state
- state = 0: all states
- state = -1: current state
- source_state > 0: specific state
- source_state = 0: include all states starting with 0
- source_state = -1: current state
- source_state = -2: last state in map
MAP AROUND THE CENTER
[edit]You can create mesh around the center of the view by specifying "center" as the selection argument.
isomesh normal, fake_map, 1.0, center
MAP OUTSIDE THE CALCULATED AREA
[edit]When map_auto_expand_sym is ON, you can create mesh beyond the precalculated volume. In this case, symmetry information (lattice constants, space group) of the model specified in the selection argument if available, or (new in 1.7) from the map object.
MAP LEVELS
[edit]- Generally speaking there is some ambiguity with visualization tools as to how map data is to treated: Some map file formats are normalized by convention (in the file data itself) and others do not. Some visualization tools automatically normalize maps upon reading, others do not. PyMOL's default behavior is dependent upon map file type: CCP4 and O/BRIX/DSN6 maps are automatically normalized upon reading (disable via normalize_* settings), other maps types are not. PyMOL's normalization is a straight statistical average of all map points -- this may or may not be what you want. If migrating to PyMOL from another tool, then it is definitely worth comparing how the maps are being represented by creating an equivalent figure in both, making sure that they match, and if they do not, then figuring out why not. From the PyMOL list. Author: Warren DeLano.
