Surface: Difference between revisions
No edit summary |
Hongbo zhu (talk | contribs) m (NOTE the coordinate system of saved coordinates) |
||
| (37 intermediate revisions by 9 users not shown) | |||
| Line 1: | Line 1: | ||
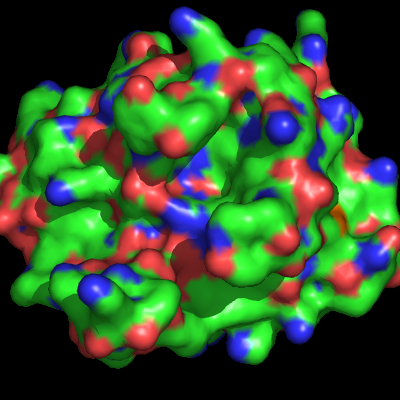
== | The surface representation of a protein, in PyMol, shows the [http://en.wikipedia.org/wiki/Connolly_surface "Connolly" surface] or the surface that would be traced out by the '''surfaces''' of waters in contact with the protein at all possible positions. [[Image:Surface_ex.png|thumb|Surface Representation Example|right]] | ||
==Enabling== | |||
To enable the surface representation do | |||
show surface, SEL | |||
for any proper selection SEL. | |||
==Settings== | |||
*[[cavity_cull]] | |||
*[[surface_best]] | |||
*[[surface_negative_color]] | |||
*[[surface_carve_cutoff]] | |||
*[[surface_negative_visible]] | |||
*[[surface_carve_normal_cutoff]] | |||
*[[surface_normal]] | |||
*[[surface_carve_selection]] | |||
*[[surface_optimize_subsets]] | |||
*[[surface_carve_state]] | |||
*[[surface_poor]] | |||
*[[surface_circumscribe]] | |||
*[[surface_proximity]] | |||
*[[surface_clear_cutoff]] | |||
*[[surface_quality]] | |||
*[[surface_clear_selection]] | |||
*[[surface_ramp_above_mode]] | |||
*[[surface_clear_state]] | |||
*[[surface_solvent]] | |||
*[[surface_color]] | |||
*[[surface_trim_cutoff]] | |||
*[[surface_debug]] | |||
*[[surface_trim_factor]] | |||
*[[surface_miserable]] | |||
*[[surface_type]] | |||
*[[surface_mode]] | |||
===Examples=== | |||
====Transparency==== | |||
To adjust the transparency of surfaces try: | To adjust the transparency of surfaces try: | ||
<source lang="python"> | <source lang="python"> | ||
| Line 6: | Line 43: | ||
Where 1.0 will be an invisible and 0.0 a completely solid surface. | Where 1.0 will be an invisible and 0.0 a completely solid surface. | ||
====Quality==== | |||
To smooth your surface representation try: | To smooth your surface representation try: | ||
<source lang="python"> | <source lang="python"> | ||
| Line 12: | Line 50: | ||
or higher if you wish, though it will take longer and might look odd. | or higher if you wish, though it will take longer and might look odd. | ||
==Displaying a protein as surface with a ligand as sticks== | ====Probe Radius==== | ||
To change the probe radius other than default 1.4 Å, you need to change the solvent radius, say, 1.6 Å: | |||
<source lang="python"> | |||
set solvent_radius, 1.6 | |||
</source> | |||
If the surface does not change correspondingly, use: | |||
<source lang="python"> | |||
rebuild | |||
</source> | |||
==Tips== | |||
=== Exporting Surface/Mesh Coordinates to File=== | |||
PyMOL can export its coordinates as WRL wireframe model files for VRML input. | |||
====Older PyMOL Versions==== | |||
<source lang="python"> | |||
# export the coordinates to povray | |||
open("surface.inc","w").write(cmd.get_povray()[1]) | |||
</source> | |||
====Newer PyMOL Versions==== | |||
<source lang="python"> | |||
# export the coordinates to .wrl file | |||
save myscene.wrl | |||
</source> | |||
or | |||
<source lang="python"> | |||
# export the coordinates to .obj file. Only surface representation can be saved as .obj. | |||
# NOTE: the coordinates are saved in camera coordinate system. | |||
save myscene.obj | |||
</source> | |||
===Representation-independent Color Control=== | |||
To color the surface representation a different color than the underlying cartoon or ligand representations, simply duplicate the object, show only the surface in the duplicate, and show only the cartoon and/or ligands in the original object. | |||
Or use the [[surface_color]] setting that is available. | |||
[[Image:Representation independent color control.jpg|thumb|Representation-independent Color Control Example|left]] | |||
===Displaying a protein as surface with a ligand as sticks=== | |||
An easy way to do this is to create separate objects for each type of display. | |||
1 Load your protein | |||
2 Select the ligand | |||
3 Create a separate object for the ligand | |||
4 Remove ligand atoms from the protein | |||
5 Display both objects separately | |||
Example: | Example: | ||
| Line 32: | Line 117: | ||
==Calculating a partial surface== | Even easier is to: | ||
There is | |||
1 Load the protein | |||
2 S (Show) > organic > stick | |||
3 S (Show) > surface | |||
===Calculating a partial surface=== | |||
There is, until now, an undocumented way to calculate a surface for only a part of an object without creating a new one: | |||
<source lang="python"> | <source lang="python"> | ||
flag ignore, not A/49-63/, set | flag ignore, not A/49-63/, set | ||
| Line 44: | Line 137: | ||
</source> | </source> | ||
See [[Get_Area]] for more information on surface area calculations. | |||
===Displaying surface inside a molecule=== | |||
==Displaying surface inside a molecule== | |||
As far as I can tell, setting ambient to zero alone doesn't quite do the job, since some triangles still get lit by the light source. The best combination I can find is: | As far as I can tell, setting ambient to zero alone doesn't quite do the job, since some triangles still get lit by the light source. The best combination I can find is: | ||
<source lang="python"> | <source lang="python"> | ||
| Line 63: | Line 156: | ||
</source> | </source> | ||
===Creating a Closed Surface=== | |||
<gallery> | |||
Image:Surface_open.png|Example OPEN Surface | |||
Image:Surface_closed.png|Example CLOSED Surface | |||
</gallery> | |||
To create what I'll call a '''closed surface''' (see images), you need to first make your atom selections, then create a new object for that selection then show the surface for that object. Here's an example. | |||
<source lang="python"> | |||
sel A, id 1-100 | |||
create B, A | |||
show surface, B | |||
</source> | |||
===Smooth surface quick (blob)=== | |||
To get a quick blob type surface (not as accurate): | |||
<source lang="python"> | |||
set solvent_radius, 4 | |||
alter all, vdw=4 | |||
sort | |||
set surface_quality, 1 | |||
</source> | |||
===Smooth surface accurate (blob)=== | |||
To get an accurate blob type surface: | |||
<source lang="python"> | |||
set surface_quality, 1 | |||
alter all, b=50 | |||
alter all, q=1 | |||
set gaussian_resolution,5 | |||
map_new mapA, gaussian, 1, sele or pdb, 6 | |||
isosurface surfA, mapA | |||
</source> | |||
'''Notes:''' Set gaussian resolution is variable with a larger number causing a more smooth surface (4 is medium and 8 is very smooth). | |||
The temperature factor field (b) has at least as much impact as the resolution setting, so increasing b factors is the more computationally efficient way of increasing the blur effect. | |||
If you are displaying more then one surface in a .pse file you must create a new map for each one (if you have three you will create mapA for the first, mapB for the second and mapC for the third), then you apply an isosurface to each map (isosurface surfA, mapA - isosurface surfB, mapB - isosurface surfC, mapC). | |||
=== Huge Surfaces === | |||
If your protein or complex is too large to render ([[ray]] runs out of RAM, for example) then check out the [[Huge_surfaces|tip for huge surfaces]]. | |||
== Performance == | |||
To optimize performance and responsiveness, PyMOL tends to defer compute-intensive tasks until their results are actually needed. Thus, | |||
<source lang="python"> | |||
cmd.show("surface") | |||
</source> | |||
doesn't actually show a surface, it only sets the surface visibility flag on the atoms present (for future reference). An actual surface won't be computed until PyMOL is asked to refresh or render the display. When running a script, you can force an update by calling: | |||
<source lang="python"> | |||
cmd.refresh() | |||
</source> | |||
after cmd.show. | |||
[[Category:Representations|Surface]] | [[Category:Representations|Surface]] | ||
[[Category:VRML]] | |||
[[Category:Surfaces]] | |||
[[Category:Performance]] | |||
Latest revision as of 08:22, 24 October 2016
The surface representation of a protein, in PyMol, shows the "Connolly" surface or the surface that would be traced out by the surfaces of waters in contact with the protein at all possible positions.
Enabling
To enable the surface representation do
show surface, SEL
for any proper selection SEL.
Settings
- cavity_cull
- surface_best
- surface_negative_color
- surface_carve_cutoff
- surface_negative_visible
- surface_carve_normal_cutoff
- surface_normal
- surface_carve_selection
- surface_optimize_subsets
- surface_carve_state
- surface_poor
- surface_circumscribe
- surface_proximity
- surface_clear_cutoff
- surface_quality
- surface_clear_selection
- surface_ramp_above_mode
- surface_clear_state
- surface_solvent
- surface_color
- surface_trim_cutoff
- surface_debug
- surface_trim_factor
- surface_miserable
- surface_type
- surface_mode
Examples
Transparency
To adjust the transparency of surfaces try:
set transparency, 0.5
Where 1.0 will be an invisible and 0.0 a completely solid surface.
Quality
To smooth your surface representation try:
set surface_quality, 1
or higher if you wish, though it will take longer and might look odd.
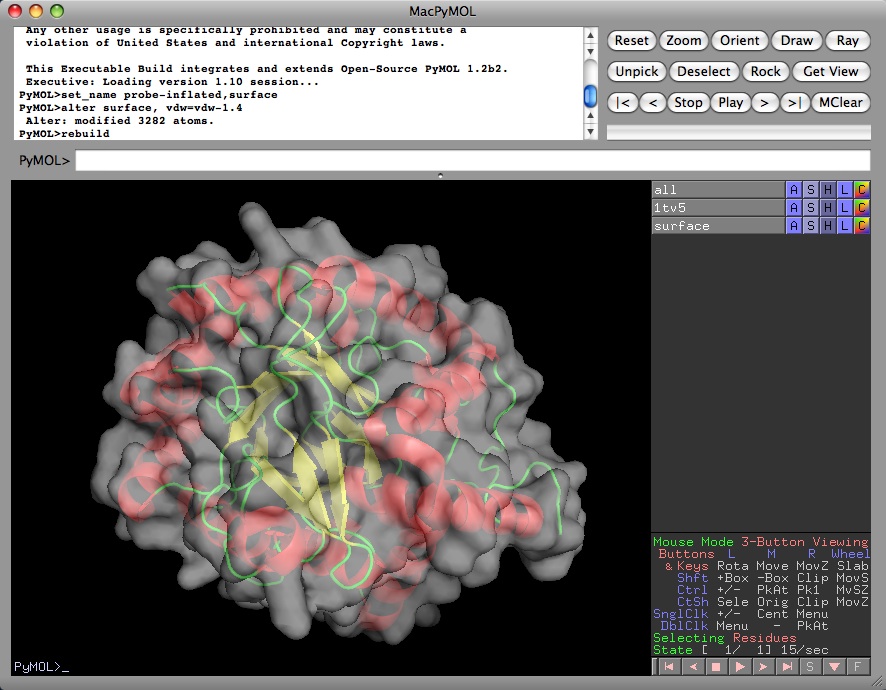
Probe Radius
To change the probe radius other than default 1.4 Å, you need to change the solvent radius, say, 1.6 Å:
set solvent_radius, 1.6
If the surface does not change correspondingly, use:
rebuild
Tips
Exporting Surface/Mesh Coordinates to File
PyMOL can export its coordinates as WRL wireframe model files for VRML input.
Older PyMOL Versions
# export the coordinates to povray
open("surface.inc","w").write(cmd.get_povray()[1])
Newer PyMOL Versions
# export the coordinates to .wrl file
save myscene.wrl
or
# export the coordinates to .obj file. Only surface representation can be saved as .obj.
# NOTE: the coordinates are saved in camera coordinate system.
save myscene.obj
Representation-independent Color Control
To color the surface representation a different color than the underlying cartoon or ligand representations, simply duplicate the object, show only the surface in the duplicate, and show only the cartoon and/or ligands in the original object.
Or use the surface_color setting that is available.
Displaying a protein as surface with a ligand as sticks
An easy way to do this is to create separate objects for each type of display.
1 Load your protein
2 Select the ligand
3 Create a separate object for the ligand
4 Remove ligand atoms from the protein
5 Display both objects separately
Example:
load prot.ent,protein
select ligand,resn FAD
create lig_sticks,ligand
remove ligand
show sticks,lig_sticks
show surface,protein
Even easier is to:
1 Load the protein
2 S (Show) > organic > stick
3 S (Show) > surface
Calculating a partial surface
There is, until now, an undocumented way to calculate a surface for only a part of an object without creating a new one:
flag ignore, not A/49-63/, set
delete indicate
show surface
If the surface was already computed, then you'll also need to issue the command:
rebuild
See Get_Area for more information on surface area calculations.
Displaying surface inside a molecule
As far as I can tell, setting ambient to zero alone doesn't quite do the job, since some triangles still get lit by the light source. The best combination I can find is:
set ambient=0
set direct=0.7
set reflect=0.0
set backface_cull=0
Which gives no shadows and only a few artifacts.
As an alternative, you might just consider showing the inside of the surface directly...that will create less visual artifacts, and so long as ambient and direct are sufficiently low, it will look reasonable in "ray".
util.ray_shadows("heavy")
set two_sided_lighting=1
set backface_cull=0
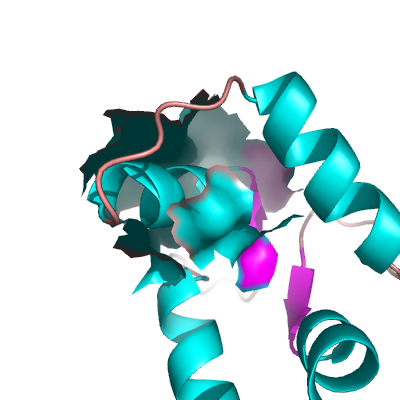
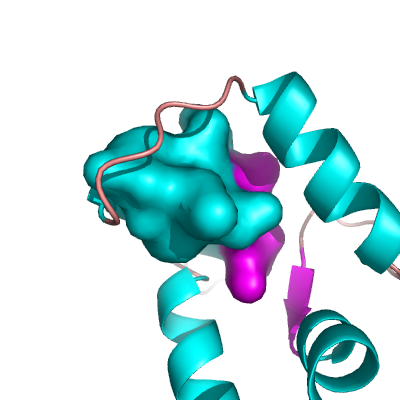
Creating a Closed Surface
To create what I'll call a closed surface (see images), you need to first make your atom selections, then create a new object for that selection then show the surface for that object. Here's an example.
 sel A, id 1-100
 create B, A
 show surface, B
Smooth surface quick (blob)
To get a quick blob type surface (not as accurate):
set solvent_radius, 4
alter all, vdw=4
sort
set surface_quality, 1
Smooth surface accurate (blob)
To get an accurate blob type surface:
set surface_quality, 1
alter all, b=50
alter all, q=1
set gaussian_resolution,5
map_new mapA, gaussian, 1, sele or pdb, 6
isosurface surfA, mapA
Notes: Set gaussian resolution is variable with a larger number causing a more smooth surface (4 is medium and 8 is very smooth). The temperature factor field (b) has at least as much impact as the resolution setting, so increasing b factors is the more computationally efficient way of increasing the blur effect. If you are displaying more then one surface in a .pse file you must create a new map for each one (if you have three you will create mapA for the first, mapB for the second and mapC for the third), then you apply an isosurface to each map (isosurface surfA, mapA - isosurface surfB, mapB - isosurface surfC, mapC).
Huge Surfaces
If your protein or complex is too large to render (ray runs out of RAM, for example) then check out the tip for huge surfaces.
Performance
To optimize performance and responsiveness, PyMOL tends to defer compute-intensive tasks until their results are actually needed. Thus,
cmd.show("surface")
doesn't actually show a surface, it only sets the surface visibility flag on the atoms present (for future reference). An actual surface won't be computed until PyMOL is asked to refresh or render the display. When running a script, you can force an update by calling:
cmd.refresh()
after cmd.show.


