Protein contact potential: Difference between revisions
No edit summary |
No edit summary |
||
| (2 intermediate revisions by one other user not shown) | |||
| Line 4: | Line 4: | ||
</gallery> | </gallery> | ||
[[ | [[Protein_contact_potential|Protein contact potential]] is an automated PyMOL representation where the false red/blue charge-smoothed surface is shown on the protein. | ||
The rule of thumb with respect to PyMOL's internal "protein contact potential" is that if you care enough to be concerned with how it works, then you should instead be using a true Possion-Boltzman electrostatics solver such as [[APBS]]. | The rule of thumb with respect to PyMOL's internal "protein contact potential" is that if you care enough to be concerned with how it works, then you should instead be using a true Possion-Boltzman electrostatics solver such as [[APBS]]. | ||
| Line 11: | Line 11: | ||
quasi-Coulombic-shaped convolution function. Nathan Baker has suggested that we simply refer to this approach as "charge smoothing". | quasi-Coulombic-shaped convolution function. Nathan Baker has suggested that we simply refer to this approach as "charge smoothing". | ||
PyMOL's use of the term "contact" relates to the fact that the potential shown by the default coloring approximates the potential that would be felt by a point-charge one solvent radius *above* the protein surface, if we ignore solvent screening and only consider nearby atoms. My personal opinion is that this sort of treatment makes a lot sense when viewing results from Poisson- | PyMOL's use of the term "contact" relates to the fact that the potential shown by the default coloring approximates the potential that would be felt by a point-charge one solvent radius *above* the protein surface, if we ignore solvent screening and only consider nearby atoms. My personal opinion is that this sort of treatment makes a lot sense when viewing results from Poisson-Boltzmann calculations as well. (Select <tt>Color by potential on sol. acc. surf.</tt> in the visualization tab of the APBS plugin to get that effect.) | ||
As an aside: It has never made any sense to me whatsoever that | As an aside: It has never made any sense to me whatsoever that electrostatics visualization programs would show potentials located right on the molecular surface given that (1) we employ point charge models that have *only* been parameterized to approximate potential energies computed between partial charges located at atomic centers and that (2) the molecular surface is located in the region of space where artifacts & noise in a PB calculation would be greatest due to discrete discontinuities between the low-dielectric interior and the high-dielectric exterior (solvent region). | ||
[[Category:Biochemical_Properties]] | [[Category:Biochemical_Properties]] | ||
[[Category:Electrostatics]] | |||
Latest revision as of 09:41, 24 June 2009
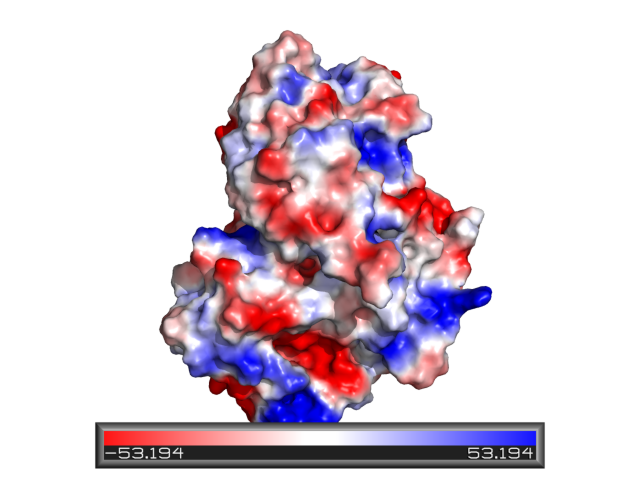
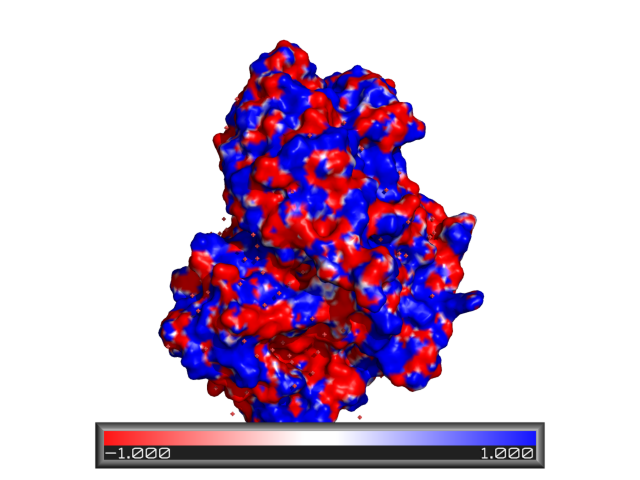
- Comparing PyMOL-generated electrostatics and APBS' version.
APBS-generated potential (see APBS).
Protein contact potential is an automated PyMOL representation where the false red/blue charge-smoothed surface is shown on the protein.
The rule of thumb with respect to PyMOL's internal "protein contact potential" is that if you care enough to be concerned with how it works, then you should instead be using a true Possion-Boltzman electrostatics solver such as APBS.
Regardless, what PyMOL does to generate a qualitative electrostatic representation (via action popup->generate->vacuum electrostatics->...) amounts to averaging charges over a small region of space using a quasi-Coulombic-shaped convolution function. Nathan Baker has suggested that we simply refer to this approach as "charge smoothing".
PyMOL's use of the term "contact" relates to the fact that the potential shown by the default coloring approximates the potential that would be felt by a point-charge one solvent radius *above* the protein surface, if we ignore solvent screening and only consider nearby atoms. My personal opinion is that this sort of treatment makes a lot sense when viewing results from Poisson-Boltzmann calculations as well. (Select Color by potential on sol. acc. surf. in the visualization tab of the APBS plugin to get that effect.)
As an aside: It has never made any sense to me whatsoever that electrostatics visualization programs would show potentials located right on the molecular surface given that (1) we employ point charge models that have *only* been parameterized to approximate potential energies computed between partial charges located at atomic centers and that (2) the molecular surface is located in the region of space where artifacts & noise in a PB calculation would be greatest due to discrete discontinuities between the low-dielectric interior and the high-dielectric exterior (solvent region).

