Mutagenesis: Difference between revisions
Jump to navigation
Jump to search
No edit summary |
|||
| (One intermediate revision by one other user not shown) | |||
| Line 2: | Line 2: | ||
PyMol has a '''Mutagenesis Wizard''' to make mutagenesis very easy for the end user. | PyMol has a '''Mutagenesis Wizard''' to make mutagenesis very easy for the end user. | ||
In [[rotkit]], a function has been made to call a mutagenesis. | |||
As of PyMOL version [https://pymol.org/dokuwiki/?id=media:new22 2.2], users may now perform base mutations in nucleotide chains. | |||
== Walk-through == | == Walk-through == | ||
To mutate a residue follow these easy steps: | To mutate a residue follow these easy steps: | ||
Latest revision as of 13:09, 25 July 2018
Mutagenesis
PyMol has a Mutagenesis Wizard to make mutagenesis very easy for the end user.
In rotkit, a function has been made to call a mutagenesis.
As of PyMOL version 2.2, users may now perform base mutations in nucleotide chains.
Walk-through
To mutate a residue follow these easy steps:
- Load a PDB file
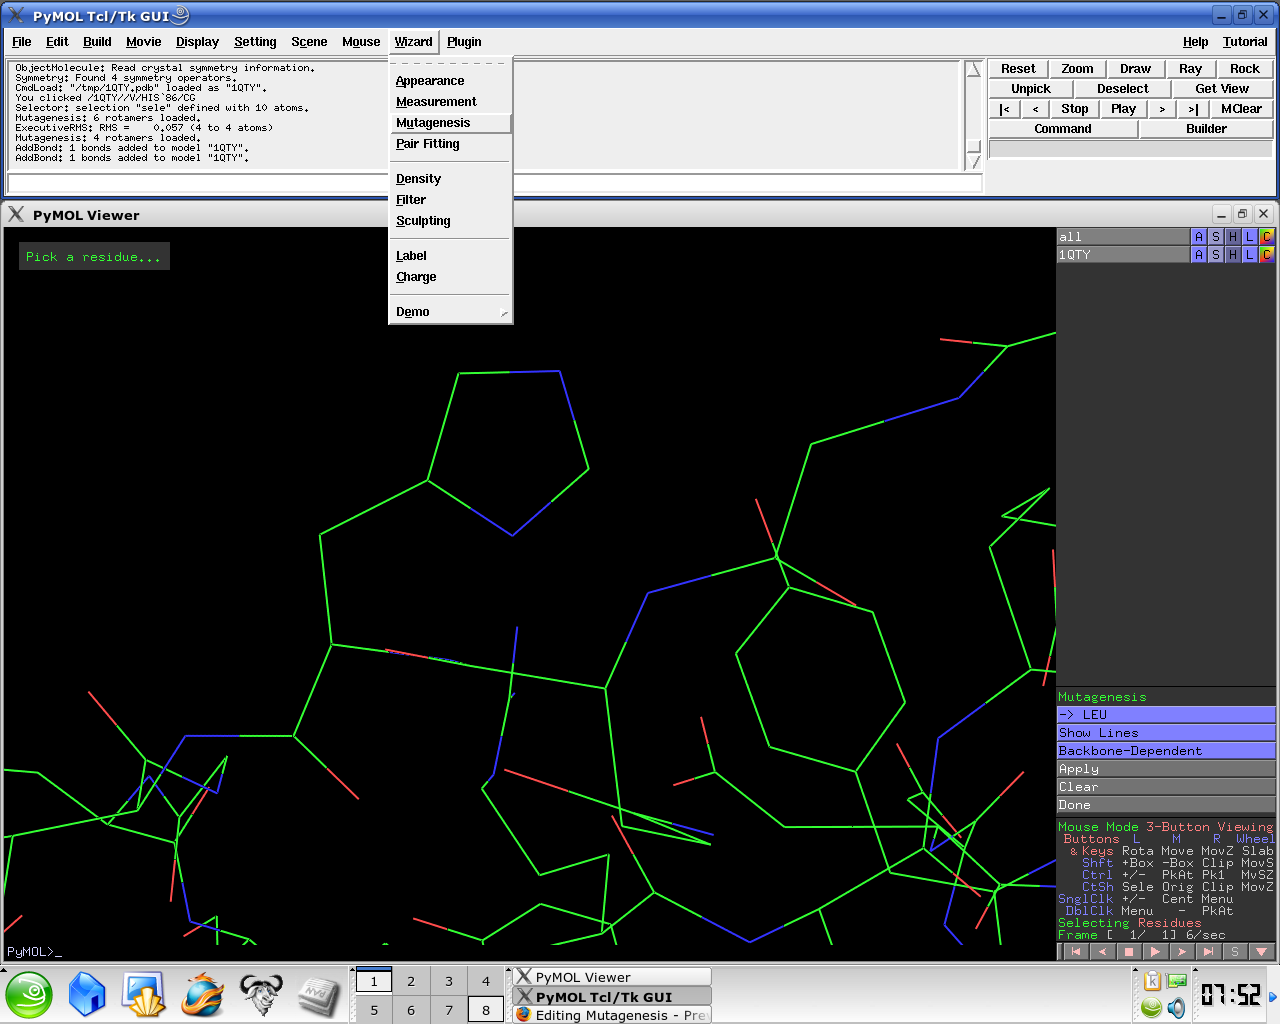
- Under the Wizard menu select Mutagenesis
- In the PyMol viewer window select a residue
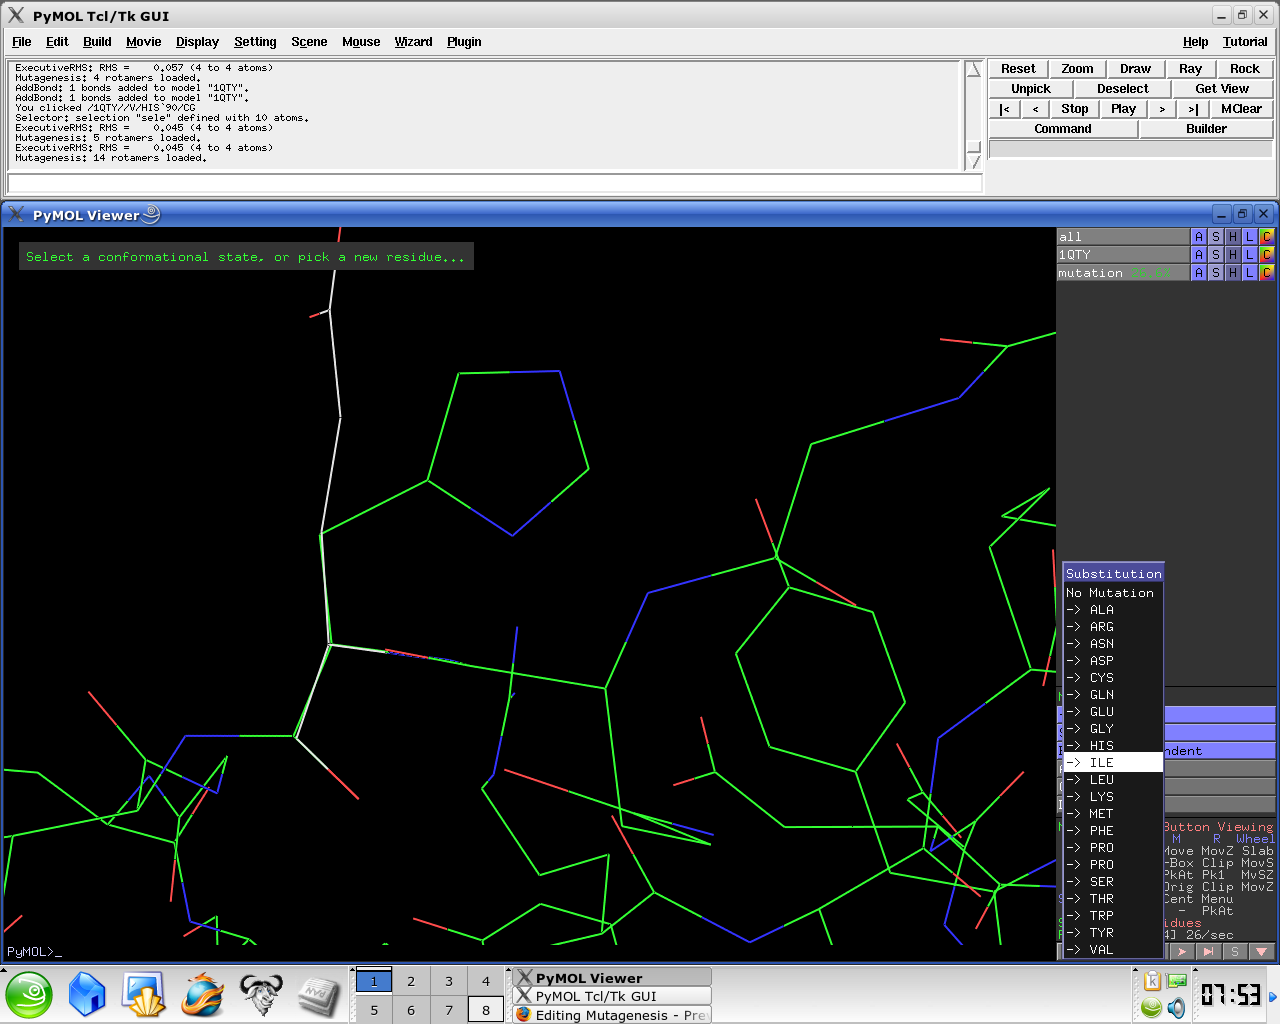
- Select No Mutation and select resultant residue
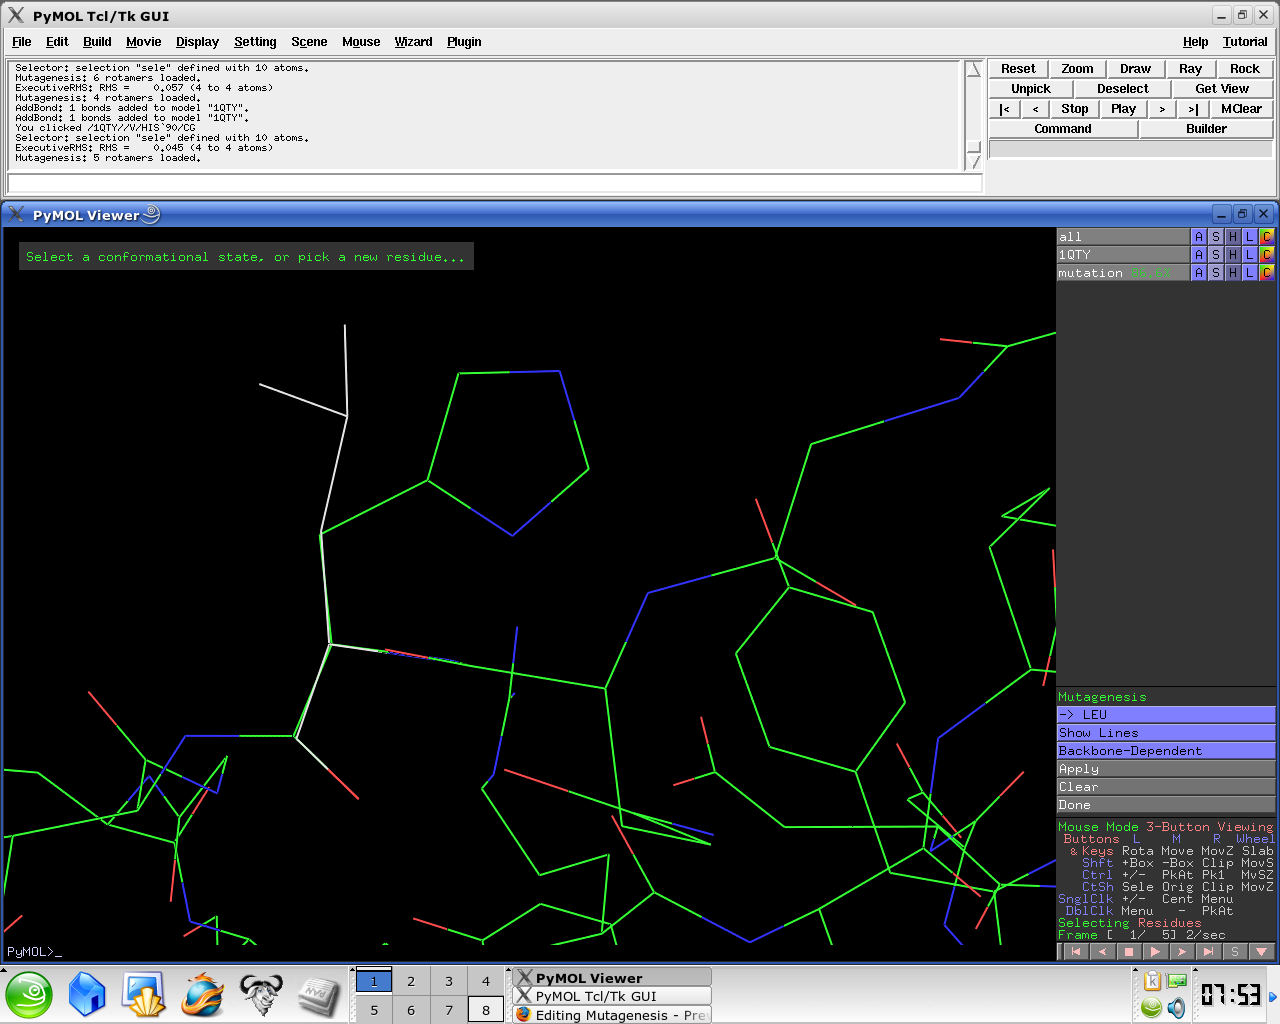
- Selecting the rotamer you think better fits your structure.
Several side chain orientations (rotamers) are possible. You can use the back-and-forth movie controls (lower right corner) to display (in white) each of the rotamers available for this residue in PyMOL, whose current and total numbers are shown in the (green) Frame info. The rotamers are ordered according to their frequencies of occurrence in proteins, shown as a red percentage at the mutation object, which exists while mutagenesis is being performed.
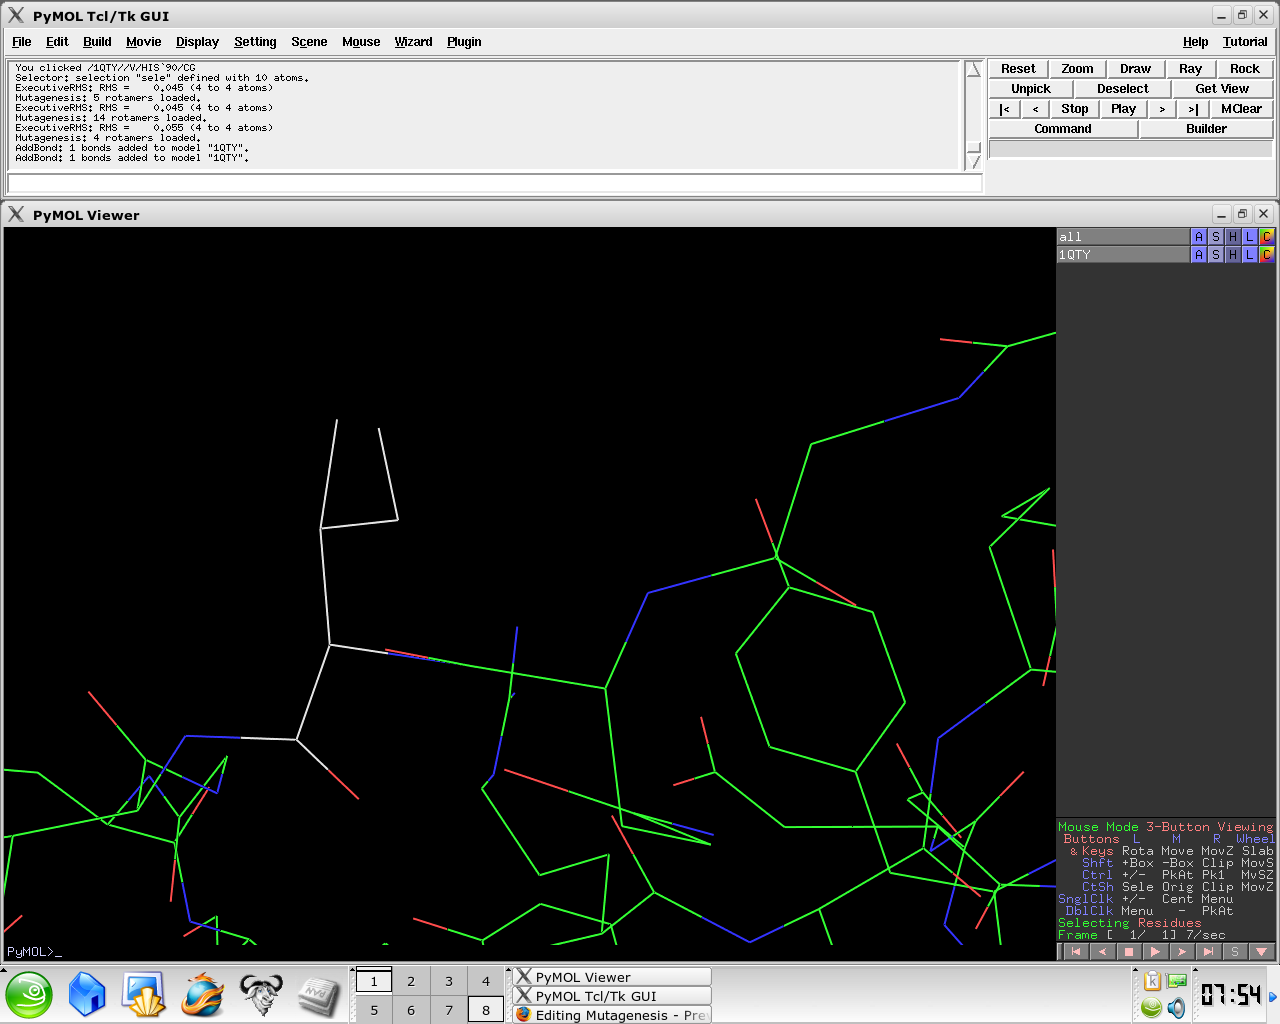
- Select Apply
- Select Done
Explanation of colour codes
From [1]:
The visible disks & colors in the Mutagenesis Wizard indicate pairwise overlap of atomic van der Waals radii. The intent is to provide a qualitative feedback regarding contacts and bumps.
Short green lines or small green disks are shown when atoms are almost in contact or slightly overlapping. Large red disks indicate signficant van der Waals overlap. Everything else lies between those extremes.


