Visualizing a computed structure - a commented example
Jump to navigation
Jump to search
The printable version is no longer supported and may have rendering errors. Please update your browser bookmarks and please use the default browser print function instead.
- Obtain the data, the following structure was published in J. Am. Chem. Soc. in the Supporting Information
- Save File.xyz.tar and untar it.
- Convert the file
- Save the following pymolscript Script.pml.tar and untar it to script.pml. Open it with an editor and adjust the Path_To_The_PDB-File. Open pymol and run the script with "@PATH_Of_The_Script/script.pml".
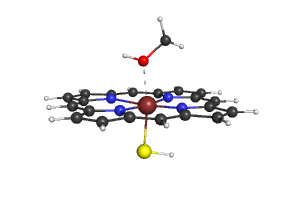
- You will get the following image, you can save it with "png filename.png"
- Use the script to modify your own pdb-file.
