Visualizing a computed structure - a commented example
- Obtain the File.xyz.tar and untar it. It contains the coordinates, which were originally published in J. Am. Chem. Soc. in the Supporting Information of this article.
- Open the file with PyMOL and save it as a pdb file.
- Save the following pymolscript Script.pml.tar and untar it to script.pml. Open it with an editor and adjust the Path_To_The_PDB. Open pymol and run the script with "@PATH_Of_The_Script/script.pml".
- You will get the following image, you can save it with "png filename.png"
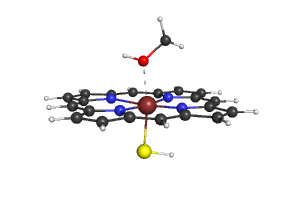
- Use the script to modify your own pdb-file.
