File list
Jump to navigation
Jump to search
This special page shows all uploaded files.
| Date | Name | Thumbnail | Size | User | Description | Versions |
|---|---|---|---|---|---|---|
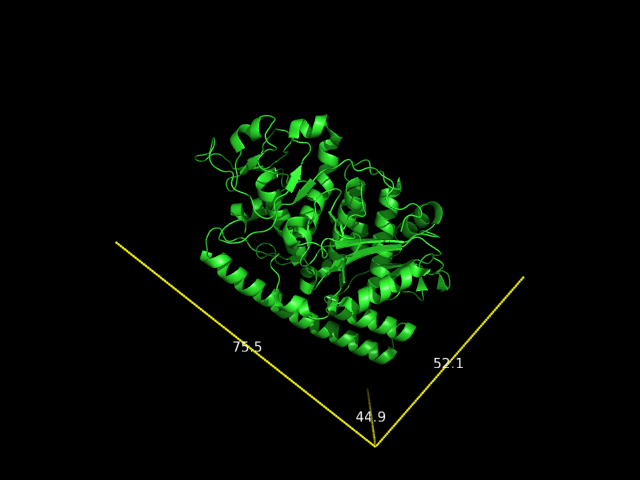
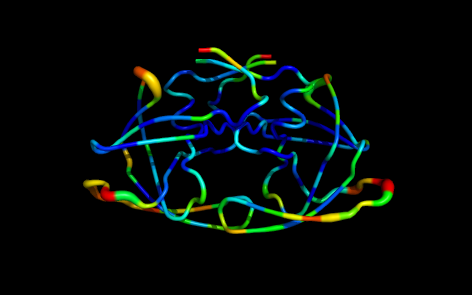
| 09:10, 14 October 2015 | 2vak A.png (file) |  |
78 KB | PabloGuardado | 1 | |
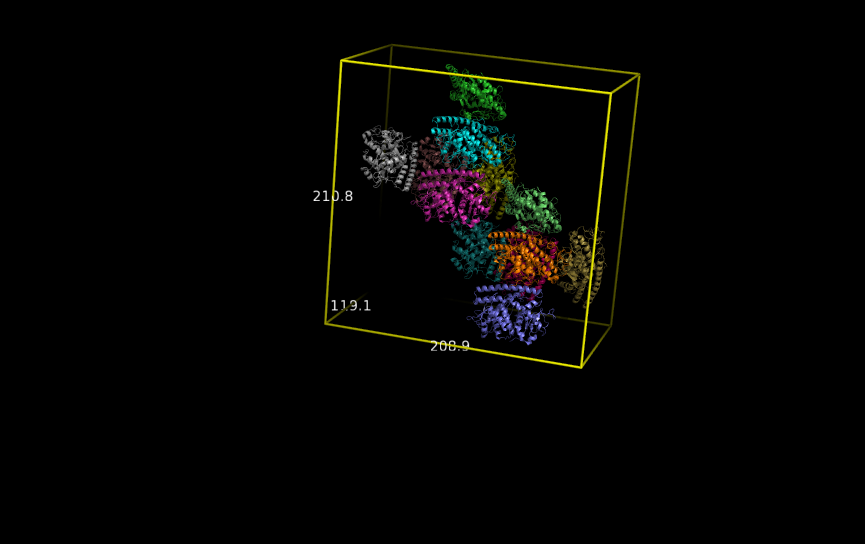
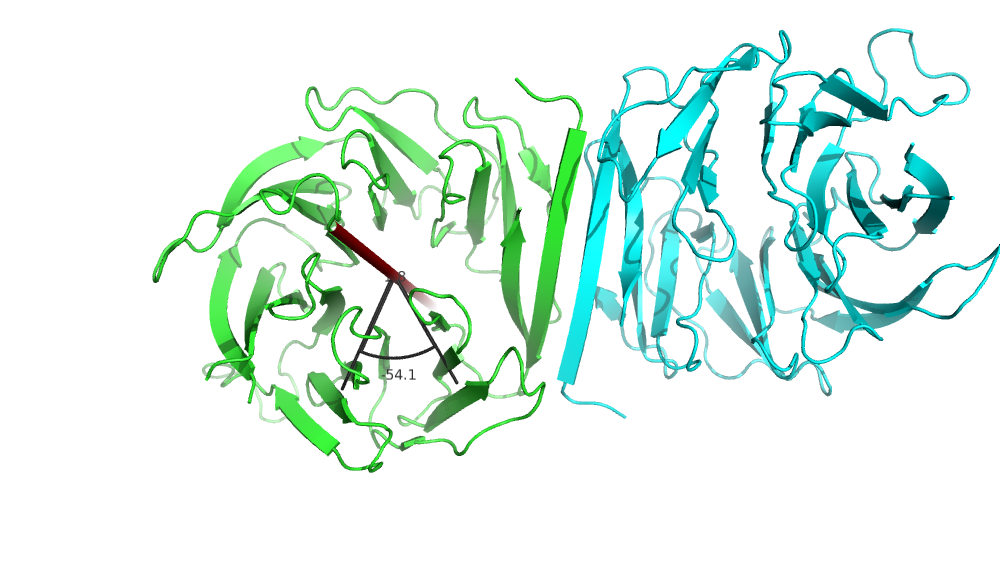
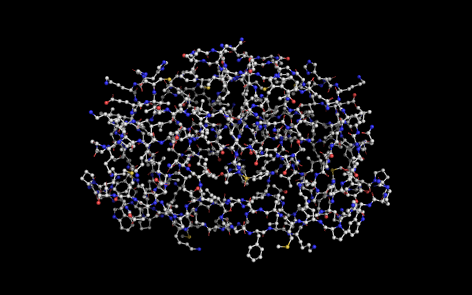
| 09:10, 14 October 2015 | 2vak AABB.png (file) |  |
98 KB | PabloGuardado | 1 | |
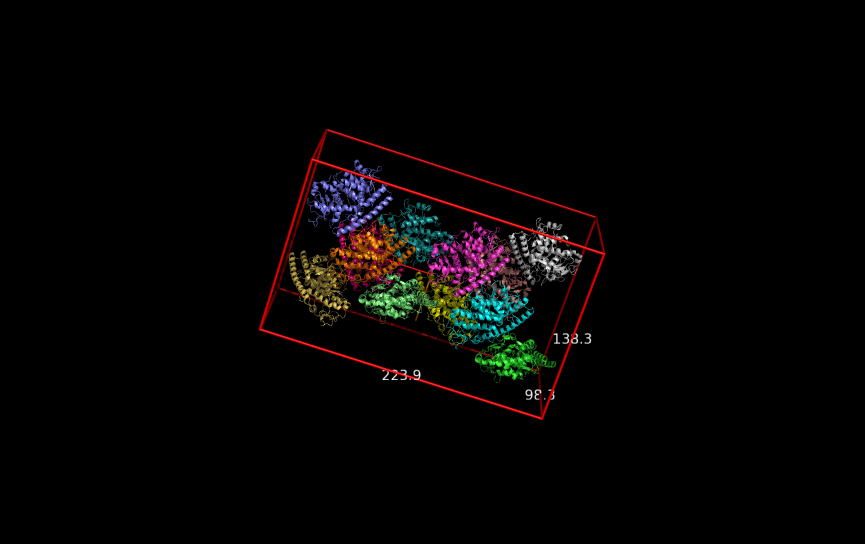
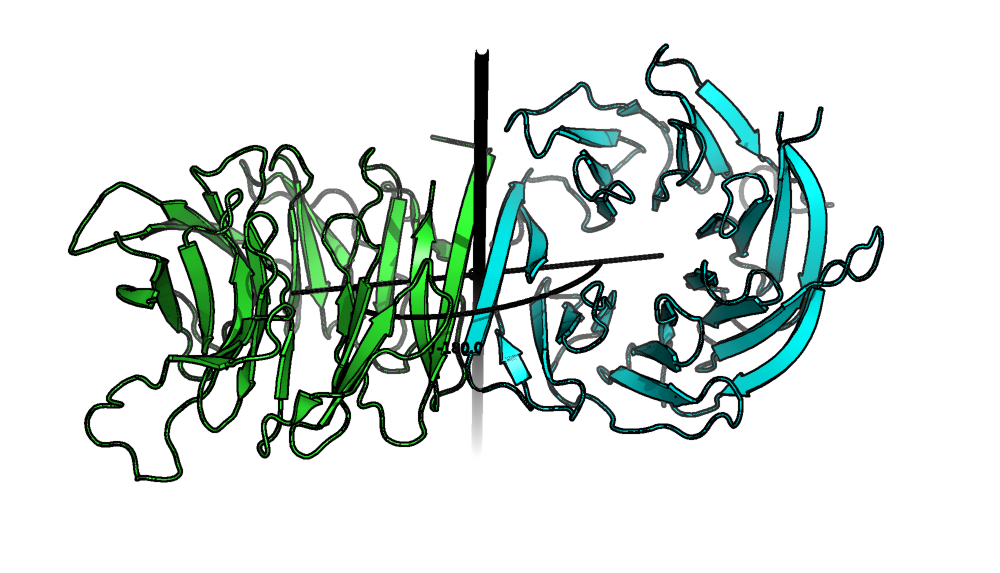
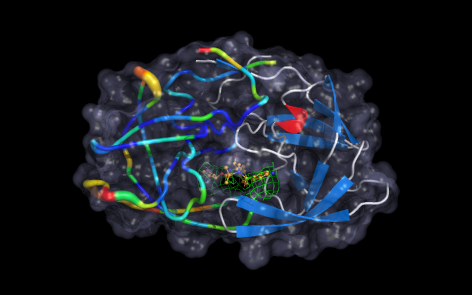
| 09:09, 14 October 2015 | 2vak IABB.png (file) |  |
111 KB | PabloGuardado | 1 | |
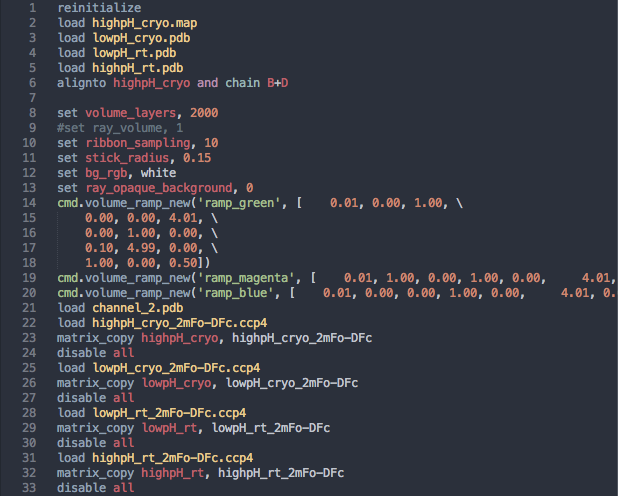
| 15:39, 10 September 2015 | 1okyVolPanel.png (file) |  |
5 KB | Speleo3 | Volume panel for File:1okyVol.png | 1 |
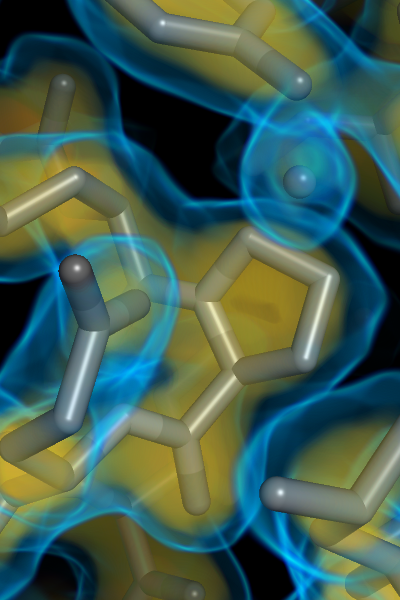
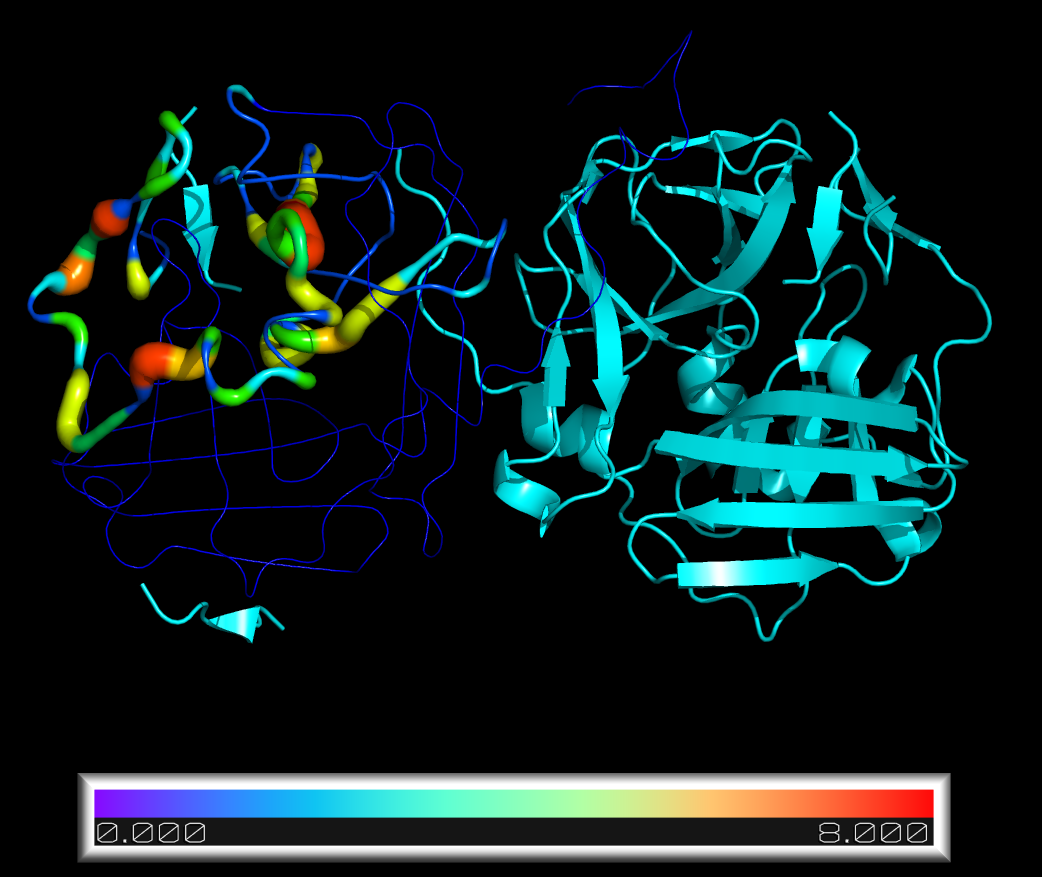
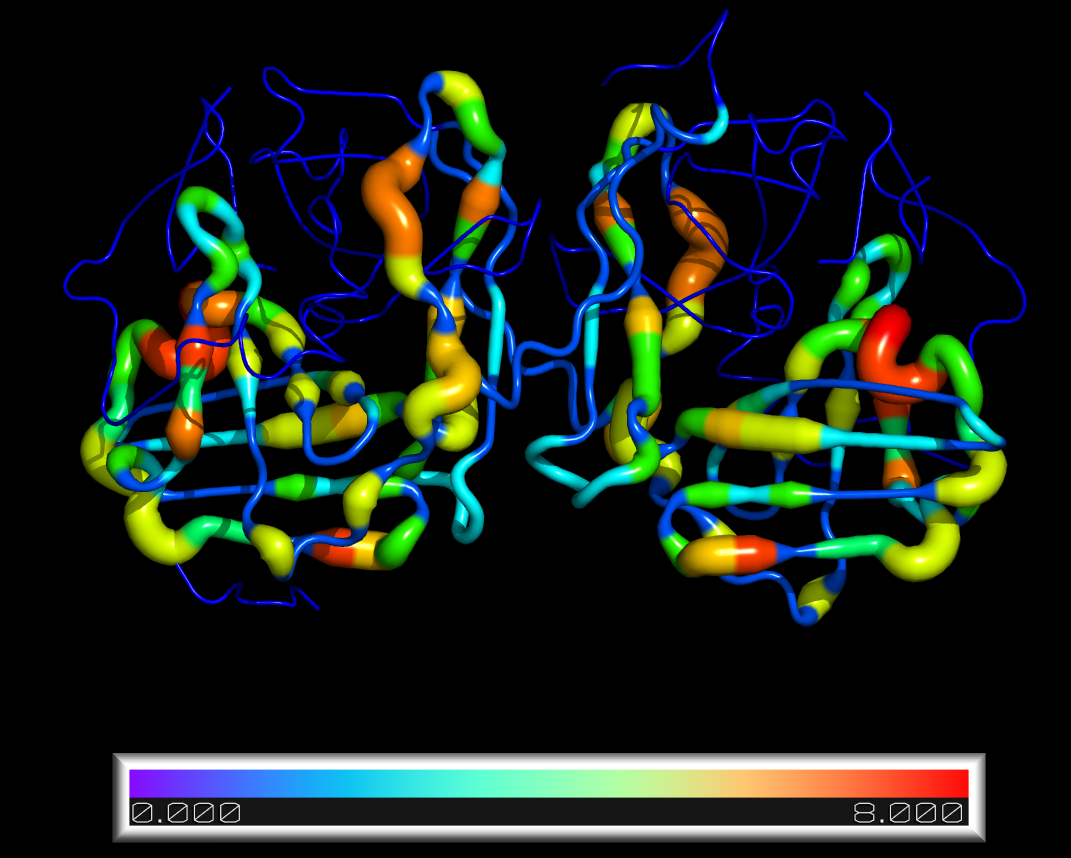
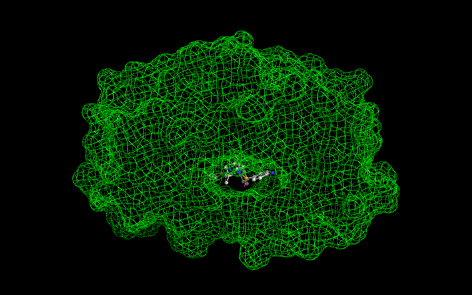
| 15:35, 10 September 2015 | 1okyVol.png (file) |  |
329 KB | Speleo3 | Volume visualization of electron density for PDB 1oky | 1 |
| 07:52, 9 September 2015 | Jctcce v011i009.jpg (file) |  |
1.73 MB | Mazen | About the Cover: The thermodynamic role of the conformational changes upon biomolecular interactions is shown to be exactly quantified using a distance measure from information theory, Kullback–Leibler (KL) divergence between the distributions of the co | 1 |
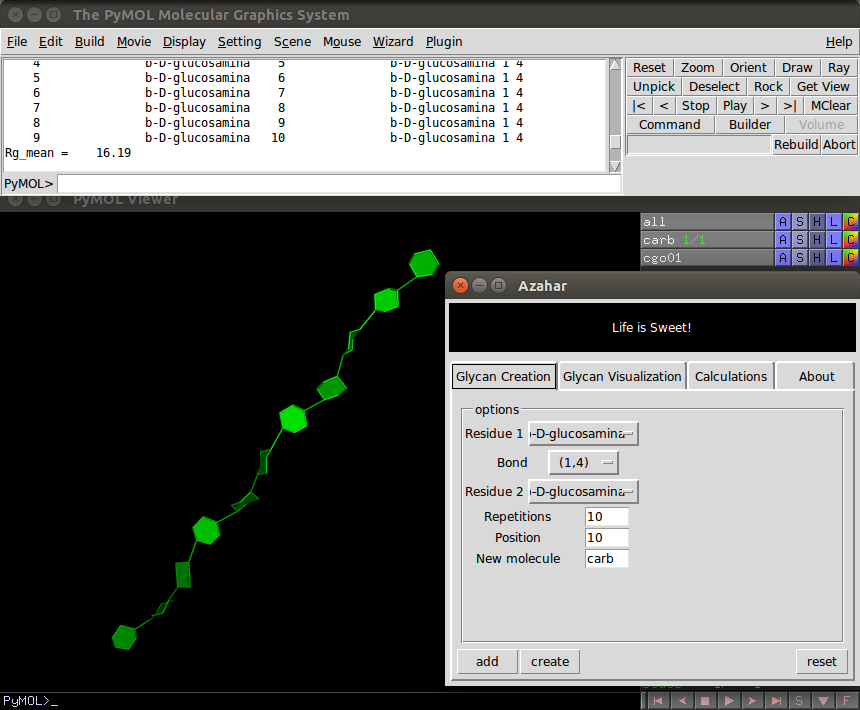
| 07:29, 9 September 2015 | Azahar GUI.png (file) |  |
102 KB | OsvaldoMartin | 1 | |
| 22:33, 8 September 2015 | J square.jpg (file) |  |
176 KB | Inchoate | Testing upload. | 1 |
| 14:12, 24 March 2015 | Frame slider.png (file) | 3 KB | Mpb21 | Screen shot of the Frame_slider GUI | 1 | |
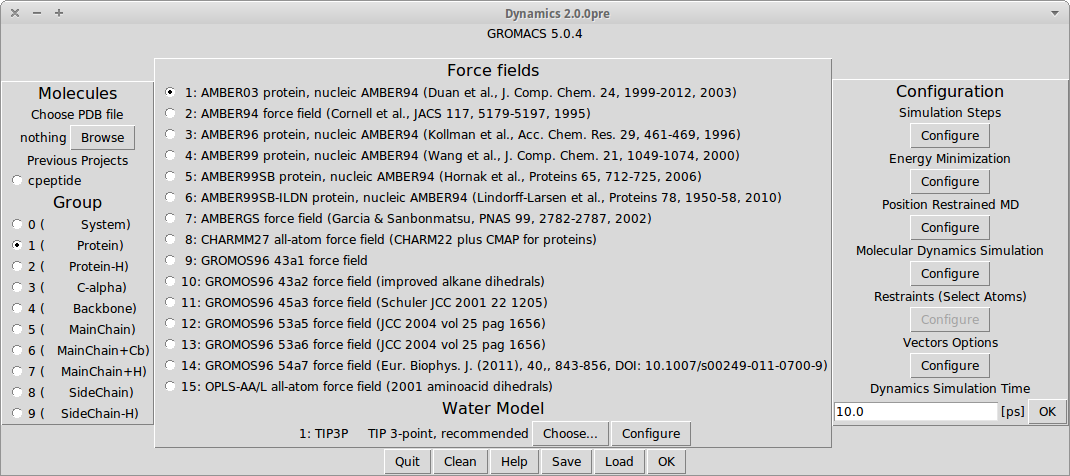
| 05:43, 10 March 2015 | Menu1.png (file) |  |
129 KB | TomaszMakarewicz | Dynamics PyMOL Plugin Menu 2.0 | 1 |
| 12:18, 15 December 2014 | 3rfg4.png (file) |  |
26 KB | PabloGuardado | 1 | |
| 12:17, 15 December 2014 | 3rfg3.png (file) |  |
25 KB | PabloGuardado | 1 | |
| 12:17, 15 December 2014 | 3rfg2.png (file) |  |
226 KB | PabloGuardado | 1 | |
| 12:17, 15 December 2014 | 3rfg1.png (file) |  |
258 KB | PabloGuardado | 1 | |
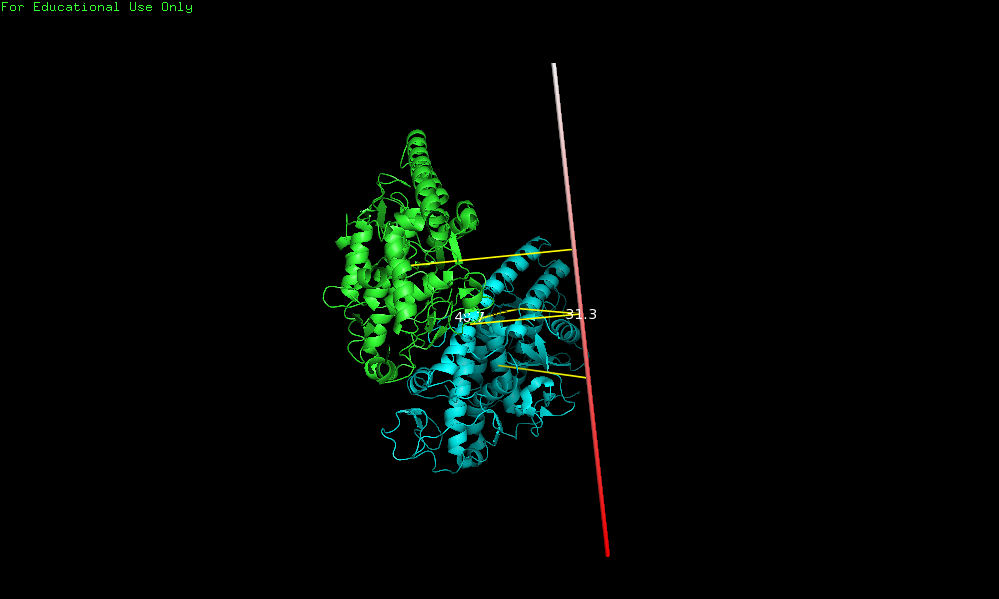
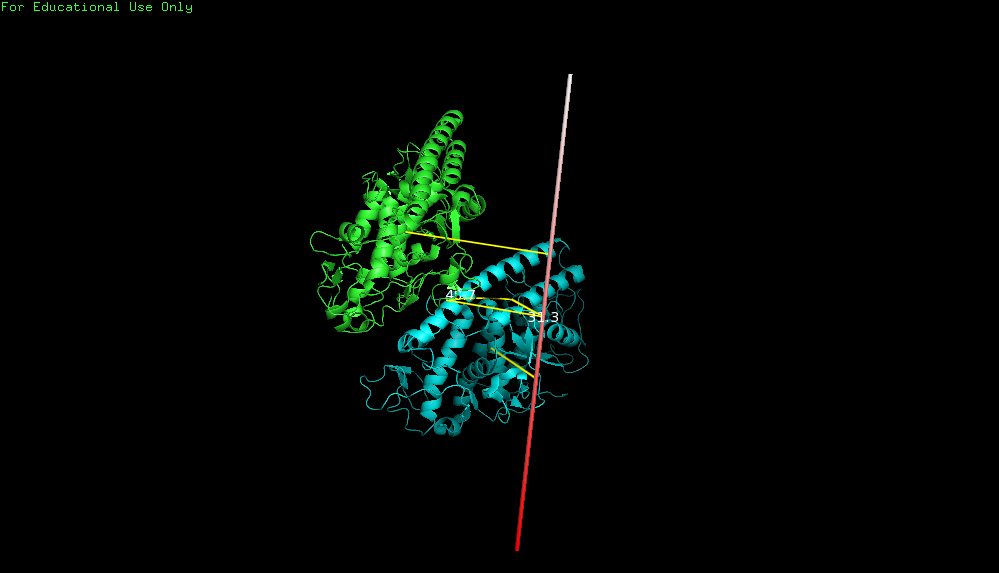
| 11:54, 15 December 2014 | 2vak4.png (file) |  |
91 KB | PabloGuardado | 1 | |
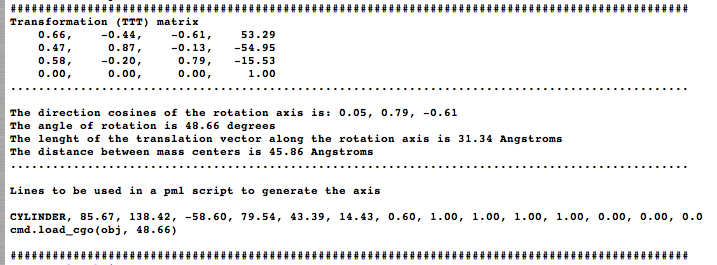
| 11:49, 15 December 2014 | 2vak2.png (file) |  |
30 KB | PabloGuardado | 1 | |
| 11:43, 15 December 2014 | 2vak 1.png (file) |  |
87 KB | PabloGuardado | 1 | |
| 05:32, 4 December 2014 | Pytms menu.png (file) |  |
154 KB | Andwar | pytms menu example | 1 |
| 05:24, 4 December 2014 | Pytms optimization animation.gif (file) |  |
423 KB | Andwar | example of PyTMs animated optimization | 1 |
| 05:23, 4 December 2014 | Pytms.gif (file) |  |
329 KB | Andwar | examples of PTM-AA | 1 |
| 20:00, 23 October 2014 | Final molecule.png (file) |  |
131 KB | RobbieSikora | The product of Ctrl + J + Enter | 1 |
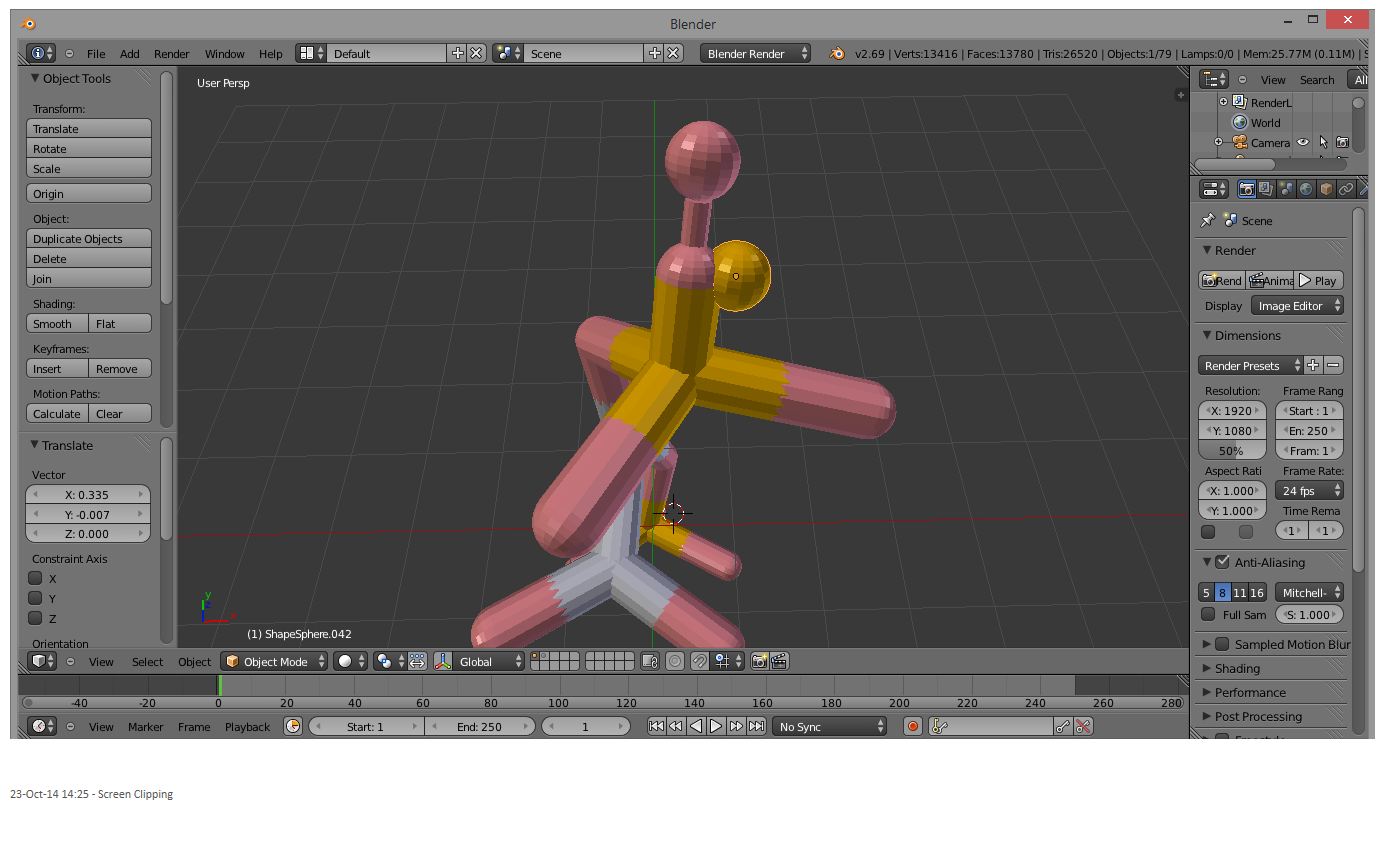
| 19:59, 23 October 2014 | Segregated molecule.png (file) |  |
139 KB | RobbieSikora | 1 | |
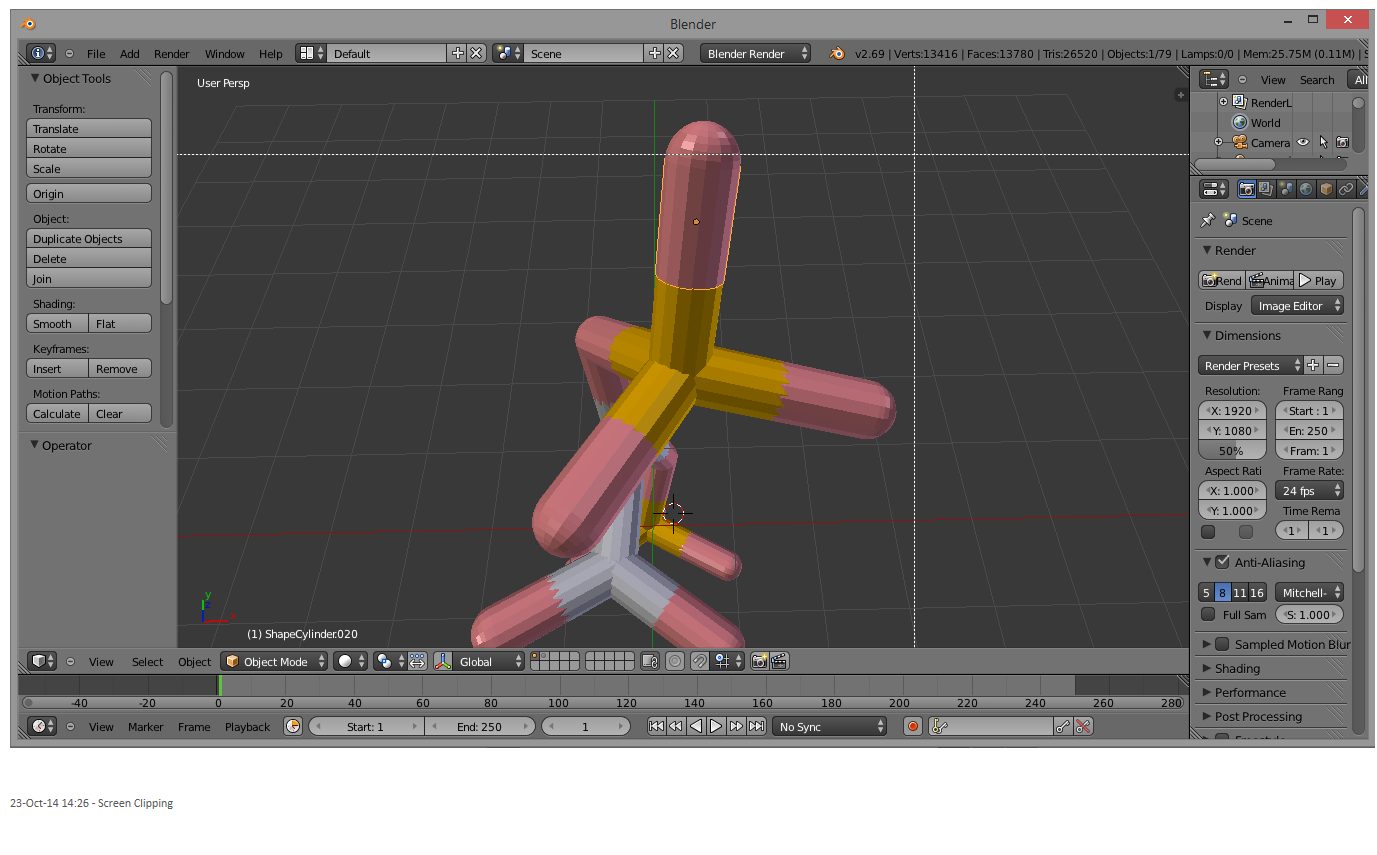
| 19:58, 23 October 2014 | Boundingboxsel.png (file) |  |
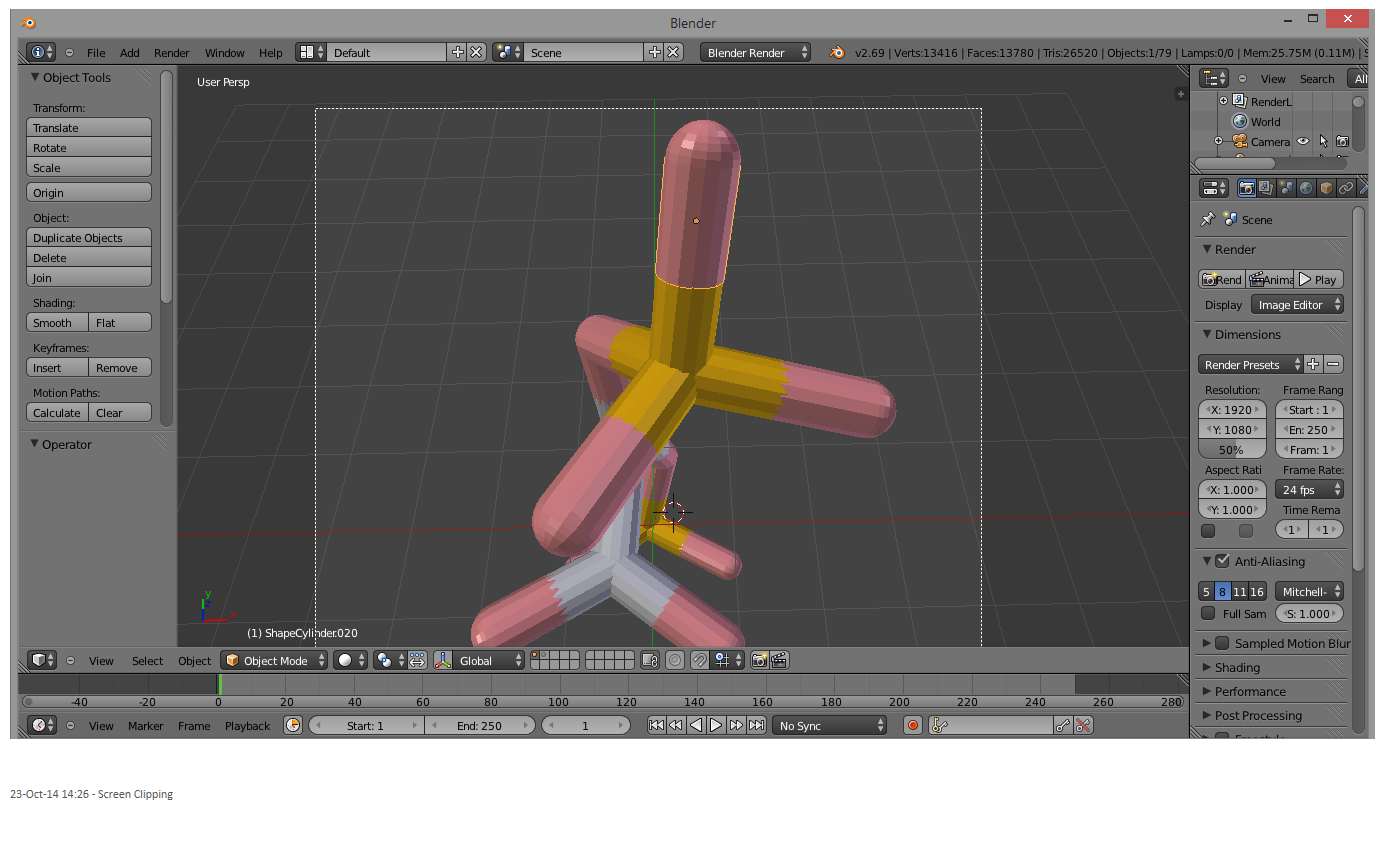
149 KB | RobbieSikora | Using the bounding box in Blender to select all the parts of a molecule. | 1 |
| 19:57, 23 October 2014 | Boundingboxstart.png (file) |  |
146 KB | RobbieSikora | 1 | |
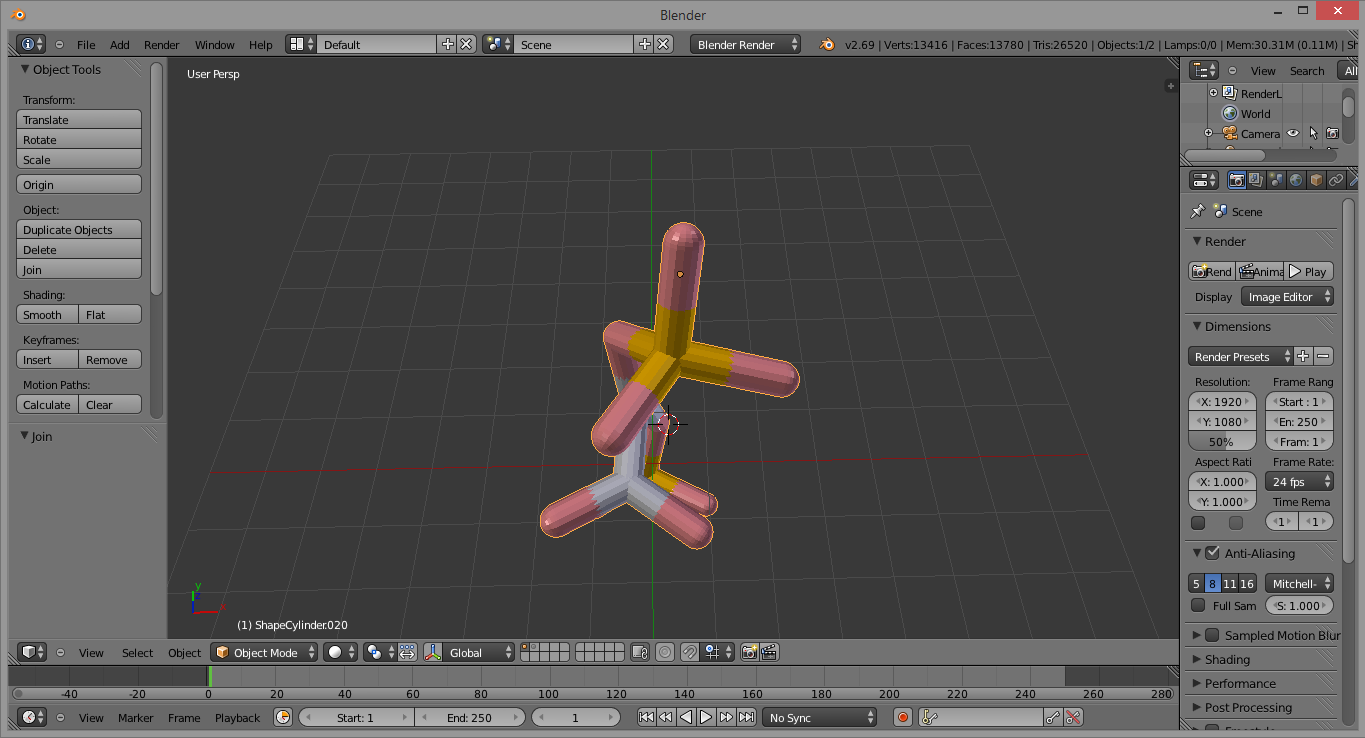
| 19:57, 23 October 2014 | Theproblem.png (file) |  |
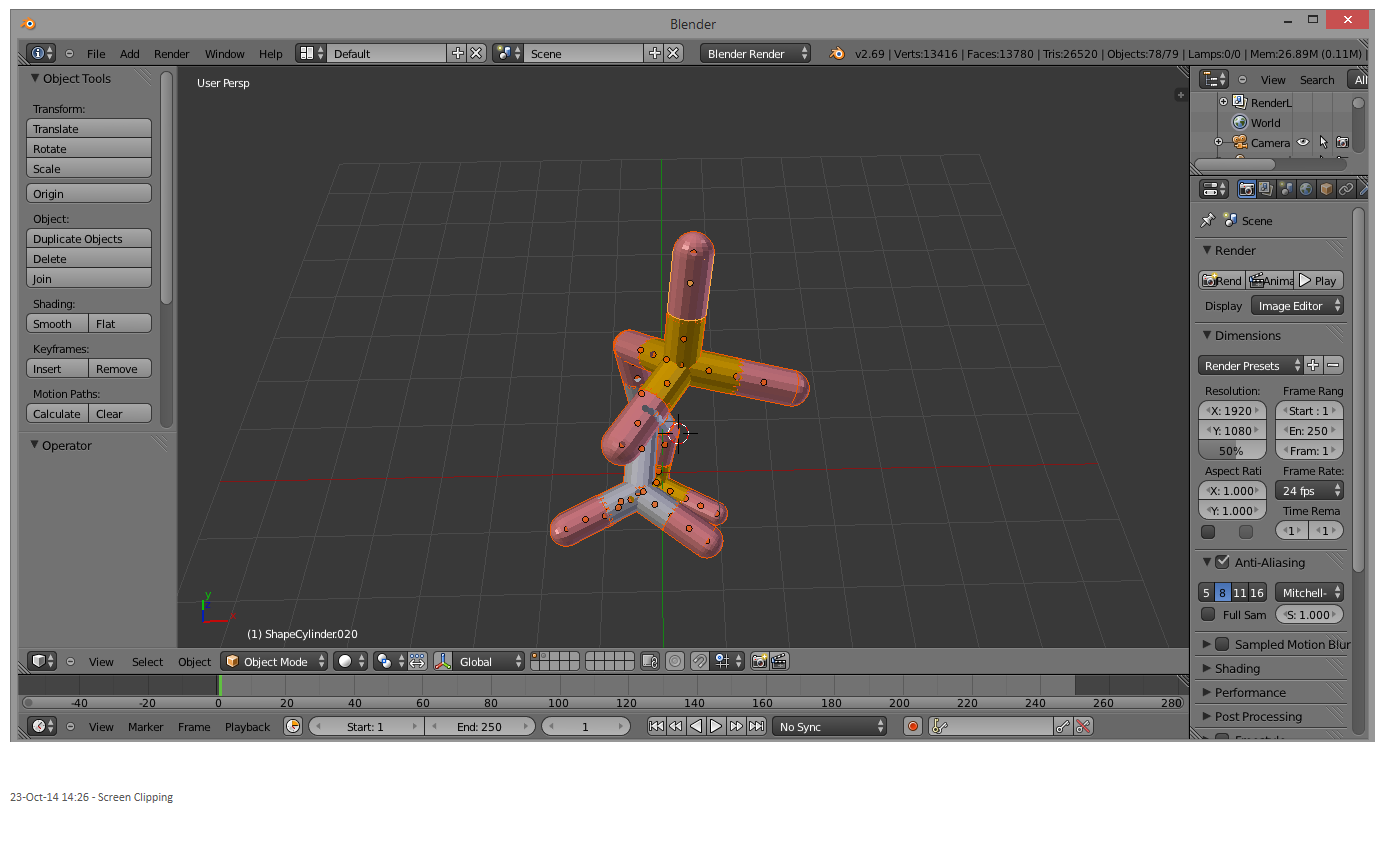
151 KB | RobbieSikora | The problem with a raw PyMOL import - there are more pieces to a molecule than meet the eye! | 1 |
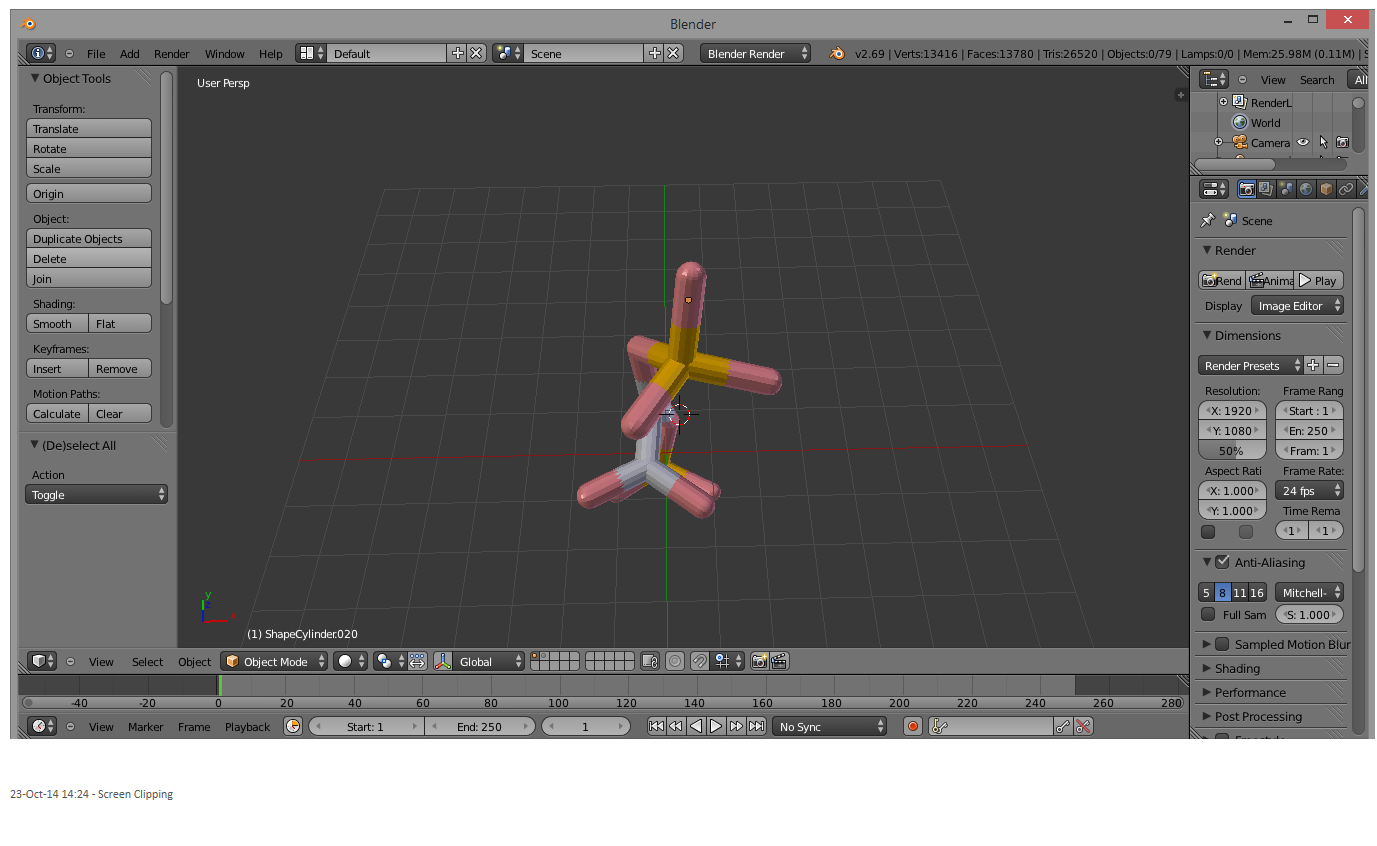
| 19:56, 23 October 2014 | Starting.png (file) |  |
134 KB | RobbieSikora | 1-2 BPG in Blender, imported from PyMOL | 1 |
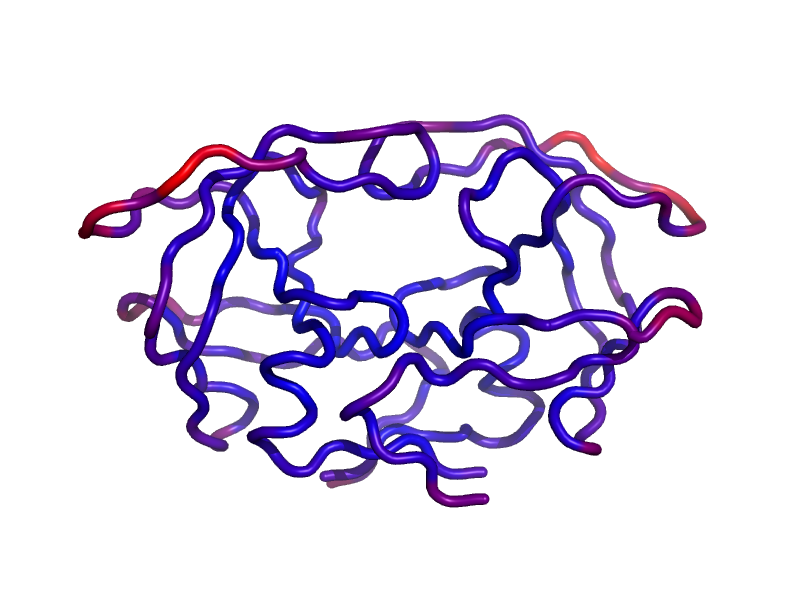
| 15:25, 19 October 2014 | Pyanm example of msf.png (file) |  |
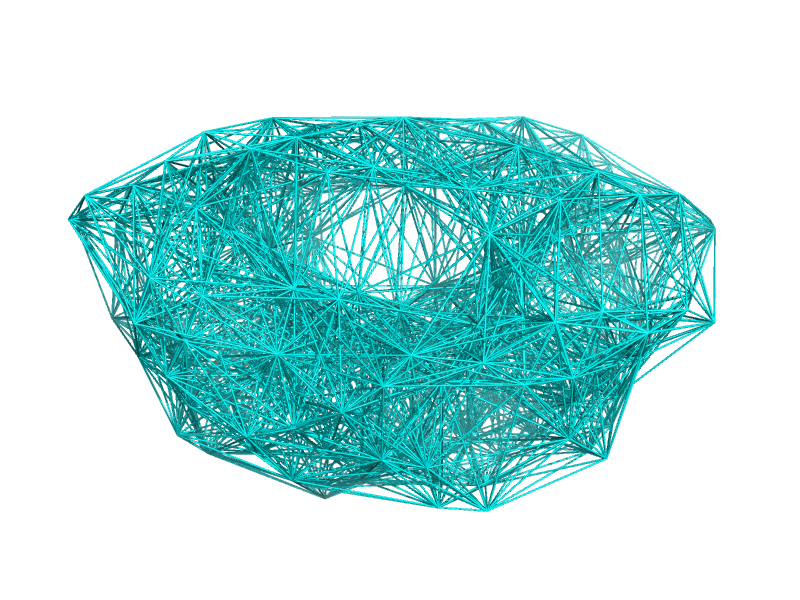
189 KB | YuanWang | PyANM: demonstration of calculated Mean Square Fluctuations (MSF) | 1 |
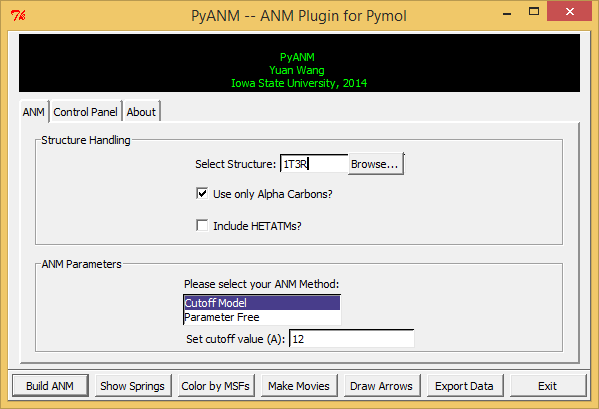
| 15:24, 19 October 2014 | PyANM interface.png (file) |  |
15 KB | YuanWang | PyANM: screenshot of PyANM interface | 1 |
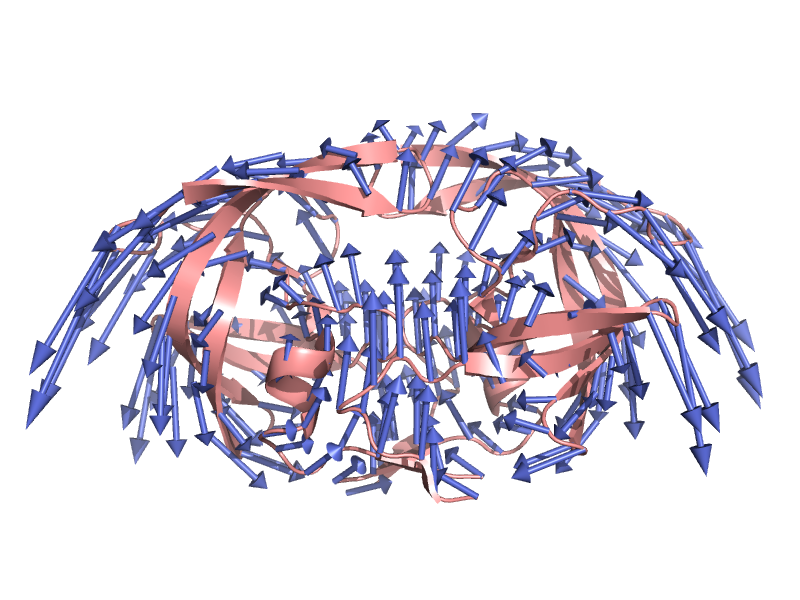
| 15:23, 19 October 2014 | Pyanm example of arrows.png (file) |  |
315 KB | YuanWang | PyANM: demonstration of arrows | 1 |
| 15:22, 19 October 2014 | Pyanm example of springs.png (file) |  |
539 KB | YuanWang | PyANM: demonstration of springs | 1 |
| 11:16, 22 September 2014 | LoadBfacts02.png (file) |  |
248 KB | PietroGattiLafranconi | 1 | |
| 11:16, 22 September 2014 | LoadBfacts1.png (file) |  |
336 KB | PietroGattiLafranconi | 1 | |
| 20:01, 3 September 2014 | Sublime text highlighting.png (file) |  |
87 KB | BenBarad | Pymol Language v0.2.2 on Sublime Text, using the Spacegray color scheme. | 1 |
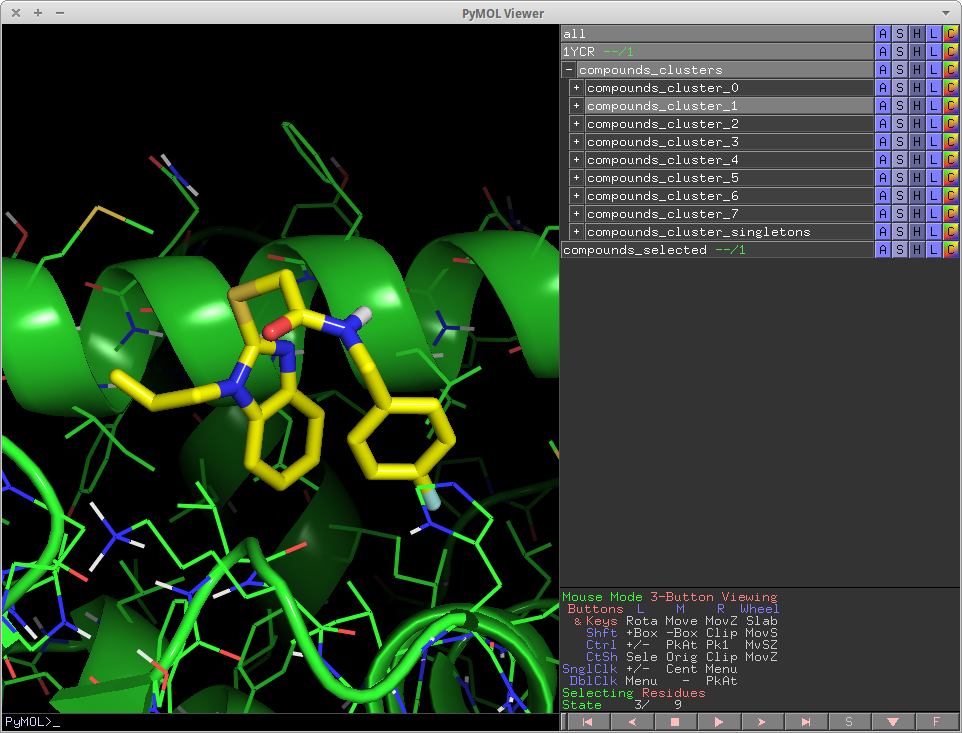
| 13:43, 24 July 2014 | Cluster mols py pymol.png (file) |  |
220 KB | Mpb21 | Some clusters loaded into pymol after clustering from cluster_mols | 1 |
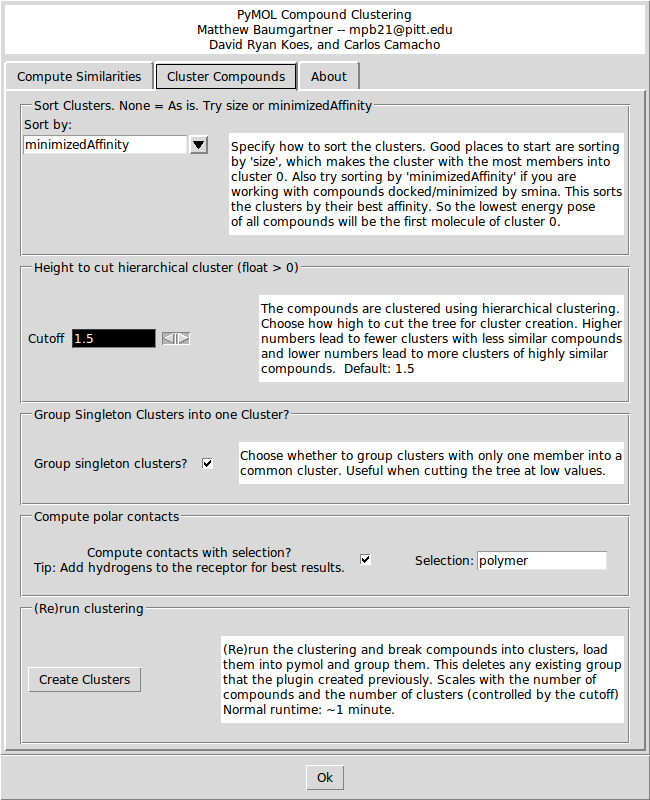
| 13:41, 24 July 2014 | Cluster mols screen 2 desc.png (file) |  |
67 KB | Mpb21 | Image of the clustering screen from cluster_mols | 1 |
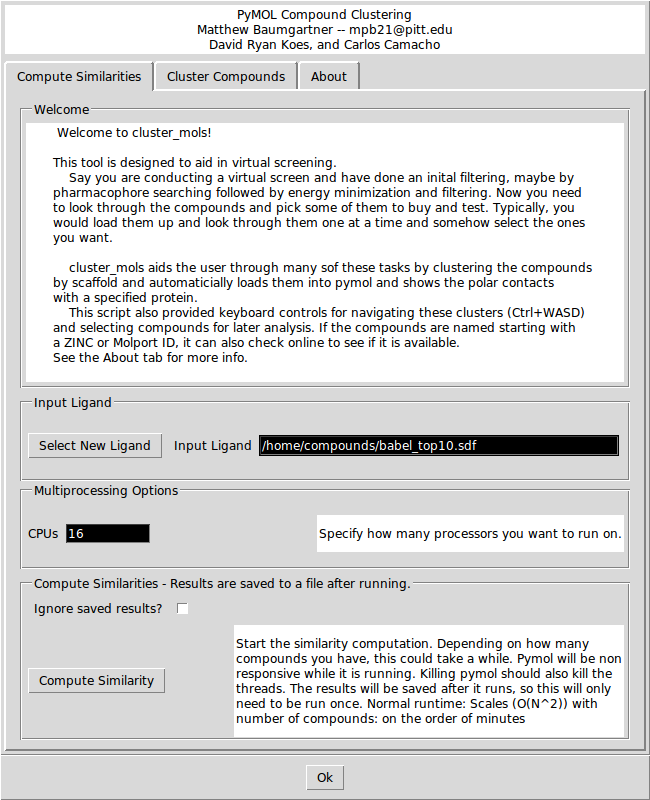
| 13:38, 24 July 2014 | Cluster mols screen 1 desc.png (file) |  |
66 KB | Mpb21 | Image of the similarity calculation screen from cluster_mols | 1 |
| 12:47, 24 July 2014 | Outline cleaned.png (file) |  |
168 KB | Jaredsampson | Cleaned-up version of Outline_composite.png, with extra outline lines erased. | 1 |
| 12:45, 24 July 2014 | Outline composite.png (file) |  |
170 KB | Jaredsampson | Composite of Outine_base.png and Outline_overlay.png. | 1 |
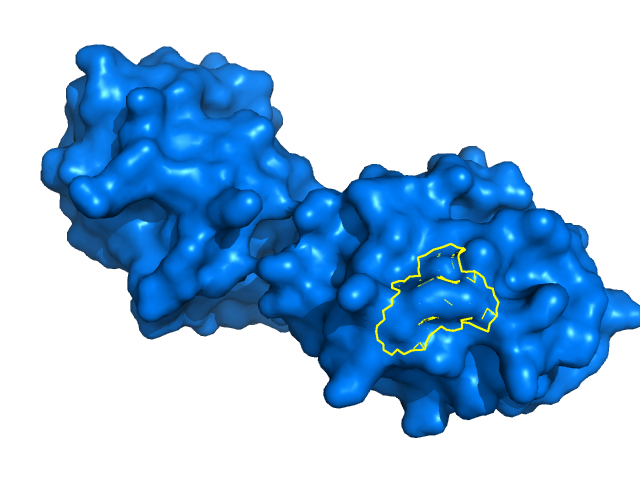
| 12:42, 24 July 2014 | Outline overlay.png (file) |  |
7 KB | Jaredsampson | Cytochrome C (3cyt) residues within 2Å of Lys85 are outlined in yellow, using `ray_trace_mode` and `ray_trace_color` settings. | 1 |
| 12:39, 24 July 2014 | Outline base.png (file) |  |
166 KB | Jaredsampson | Surface representation of Cytochrome C (3cyt). | 1 |
| 07:32, 16 July 2014 | Cgo grid.gif (file) |  |
870 KB | Andwar | cgo_grid example | 1 |
| 07:32, 16 July 2014 | Cgo grid.png (file) |  |
28 KB | Andwar | concept sketch | 1 |
| 06:23, 13 July 2014 | Distancetoatom 2.png (file) |  |
116 KB | Andwar | using distancetoatoms for labeling distances | 1 |
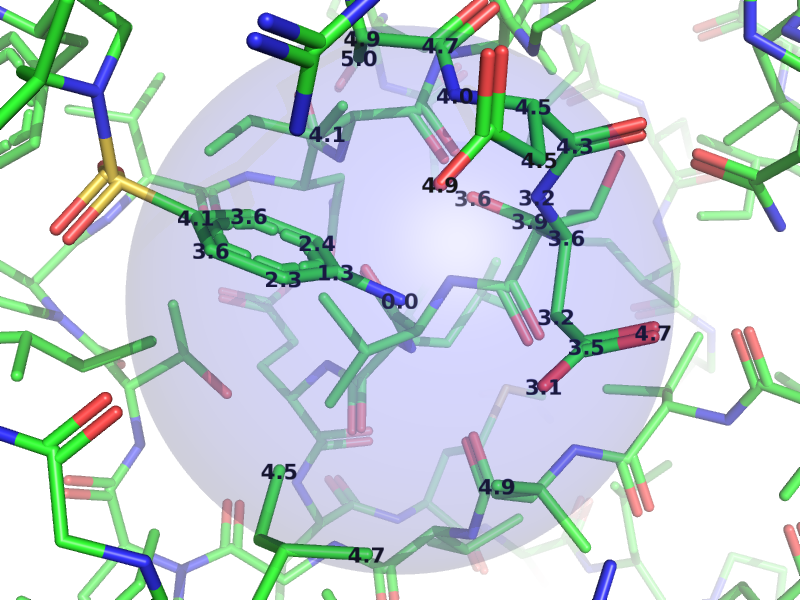
| 06:22, 13 July 2014 | Distancetoatom 1.png (file) |  |
189 KB | Andwar | using distancetoatoms for coloring by distance | 1 |
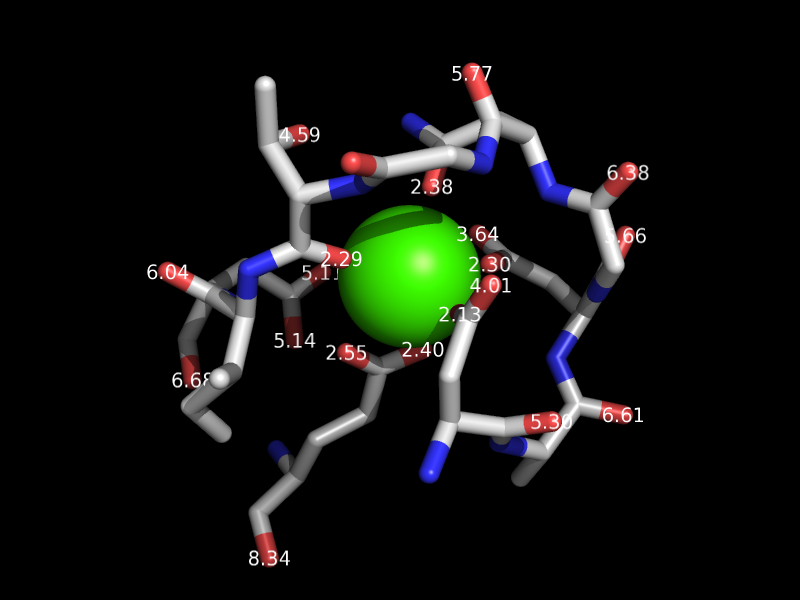
| 06:22, 13 July 2014 | Distancetoatom 0.png (file) |  |
354 KB | Andwar | Depiction for distancetoatoms illustrating cutoff | 1 |
| 08:18, 10 June 2014 | 1LSD random colors.png (file) |  |
102 KB | Andwar | example for using get_random_color | 1 |
| 05:03, 10 June 2014 | Quickdisplays combo.png (file) |  |
114 KB | Andwar | example quickdisplays - combined | 1 |
| 05:02, 10 June 2014 | Quickdisplays disp ball stick.png (file) |  |
95 KB | Andwar | example: quickdisplays.disp_ball_stick | 1 |
| 05:01, 10 June 2014 | Quickdisplays disp mesh.png (file) |  |
117 KB | Andwar | example: quickdisplays.disp_mesh | 1 |
| 05:01, 10 June 2014 | Quickdisplays disp putty.png (file) |  |
47 KB | Andwar | example: quickdisplays.disp_putty | 1 |