Rotkit
Author
This pymol script is made by Troels Emtekær Linnet
Introduction
This script-kit is a collection of small script to be able to precisely to put a molecule (like a dye) where you want in relation to a protein. It simply makes the PyMOL TTT matrixes, in a easy and user friendly way. The calls to the functions available in PyMOL, takes care of all the conversion of input and such.
If you are interested in this, you might also want to check out the PyMOL Chempy module that is included in PyMOL. It provides handy vector and matrix functions.
Available in PyMOL
- rotateline(Pos1,Pos2,degangle,molecule):
- "Pos1->Pos2" define a line whereabout "molecule" will be rotated "degangle" degrees
- rotateline Pos1=P513C_CA, Pos2=P513C_CB, degangle=5, molecule=Atto590
- rotateline Pos1=dyeatom87, Pos2=dyeatom85, degangle=10, molecule=Atto590
- mutate(molecule,chain,resi,target="CYS",mutframe="1"):
- Mutate a /molecule//chain/resi into a target, and selecting most probable frame 1
- mutate 1HP1, chain=A, resi=515, target=CYS, mutframe=1
- toline(Pos1,Pos2,atom,molecule,dist=1):
- Translate molecule atom, 1 angstrom away in the same direction Pos1->Pos2 specify
- toline Pos1=P513C_CA, Pos2=P513C_CB, atom=dyeatom87, molecule=Atto590, dist=3
Available through PyMOL mini shell
- printMat(matrix):
- prints the TTT matrix in a readable format. (4X4)
- getxyz(Sel):
- output is a list [x,y,z] in float. The input can be a list, a string(list) or a selection.
- vector(Sel1,Sel2):
- Finds the vector between points. Gets the xyz list from getxyz, so input can be anything.
- vectorstr(vector):
- turn a vector in list format into string. No real function actually.
- transmat(vector,dist=1):
- Makes a TTT translation matrix for according to the input vector. The vector is multiplied with dist.
- unitvector(vector):
- Make a vector a unitvector.
- radangle(angle):
- Convert degree to radians. Not that all input are assumed to be in degrees, and are converted automatically.
- rotmat(angle,vectornorm,pointcoord):
- This function is the most important. That makes the TTT matrix that rotates a molecule around a normalized vector, which goes through a coordinate point.
- crossprod(Vector1, Vector2):
- Makes a crossproduct between two vectors
- crosspoint(Pos1, crossprod):
- Returns the endpoint for the Position plus the crossproduct vector. Suitable if one would like to rotate around a crossvector.
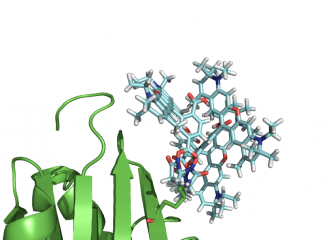
Place your dye how you want. You always get same ending position.
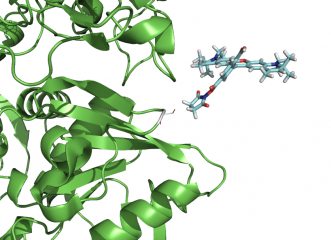
Mutate a residue through command line, and quickly put your dye there.


Example of use
To understand how the script works, read through the tutorial. Unhash "##" each step at the time to see the effect.
Note, the python mini shell is important, to get the return values of the functions.
A tutorial.pml file
To be able to follow the tutorial, you need the dye molecule. Right clicking the following link here -> Save as: Atto590.pdb in the directory with the tutorial.pml file
https://raw.github.com/Pymol-Scripts/Pymol-script-repo/master/files_for_examples/Atto590.pdb
#-------------------------------------------------------------------------------
# Name:		rotkit.py
# Purpose:      To rotate molecules easier in pymol
#
# Author:      tlinnet
#
# Created:     30/08/2011
# Copyright:   (c) tlinnet 2011
# Licence:     Free
#-------------------------------------------------------------------------------

cd C:\Users\tlinnet\Documents\My Dropbox\Speciale\5NT-project\Mutant-construct\Distance-Plot
import rotkit

#fetch 1HP1, async=0
load 1HP1.pdb
load Atto590.pdb

### Get the names of the loaded objects
protname = cmd.get_names()[0]
molname = cmd.get_names()[1]

### Make the names we are going to use
protselectCB="%s and resi 308 and name CB"%protname
protnameselectCB="K308CB"
protselectCA="%s and resi 308 and name CA"%protname
protnameselectCA="K308CA"
molselect87="%s and id 87"%molname
molnameselect87="dyeatom87"
molselect85="%s and id 85"%molname
molnameselect85="dyeatom85"

### Make some selections
cmd.select("%s"%protnameselectCB,"%s"%protselectCB)
cmd.select("%s"%protnameselectCA,"%s"%protselectCA)
cmd.select("%s"%molnameselect85,"%s"%molselect85)
cmd.select("%s"%molnameselect87,"%s"%molselect87)

### Make nice representations
cmd.show_as("cartoon","%s"%protname)
cmd.show("sticks","byres %s"%protnameselectCB)

##### PART I: Use of functions #####
### This view will take you to the first part
set_view (\
     0.377224118,    0.880101919,   -0.288305759,\
     0.661396861,   -0.473919988,   -0.581338286,\
    -0.648268998,    0.028612033,   -0.760871351,\
     0.000000000,    0.000000000,  -56.408561707,\
    19.480533600,   34.572898865,    6.978204727,\
    46.615653992,   66.201446533,  -20.000001907 )

#### Just unhash each part for itself, as you continue through
#### The python mini shell is important, to get the return values of the functions

### To print a objects TTT matrix in a readable format
python
rotkit.printMat(cmd.get_object_matrix(molname))
python end

##### We want to move the dye to a desired location, and rotate it to a view we desire
##### First get the vector bewteen the dyeatom and the protein atom
##python
##diffvector = rotkit.vector("%s"%molselect87,"%s"%protnameselectCB)
##python end
##
##### Then move the dye
##python
##move = rotkit.transmat(diffvector)
##### print the matrix for fun
##rotkit.printMat(move)
##### Move the dye
##cmd.transform_selection("%s"%molname,move)
##python end
##
##### Now we want to displace the dye in the CA-CB bond direction
##python
##### First find the vector/direction to displace it in. From A -> B
##diffvector = rotkit.vector("%s"%protnameselectCA,"%s"%protnameselectCB)
##### Make the vector so its lenth is equal 1
##uvector = rotkit.unitvector(diffvector)[0]
##### Make the move translation matrix, and we multiply the matrix with 3, so it moves 3 Angstrom
##move = rotkit.transmat(uvector,3)
##### Print the matrix
##rotkit.printMat(move)
##### Displace it in the CA-CB direction
##cmd.transform_selection("%s"%molname,move)
##python end
##
##### Now we want to rotate it a single time. We convert 40 degress to radians
##### The input is the angle, the line to rotate around, and a point where the line goes through
##python
##CBxyz = rotkit.getxyz("%s"%protnameselectCB)[0]
##rmat = rotkit.rotmat(rotkit.radangle(40),uvector,CBxyz)
##rotkit.printMat(rmat)
##### Copy paste this line into pymol to see it manually
##cmd.transform_selection("%s"%molname,rmat)
##python end
##
##### We are not quite satisfied, we want to rotate it around its own bond
##### So we rotate in around its own 87-85 bonds
##python
##diffvector = rotkit.vector("%s"%molnameselect87,"%s"%molnameselect85)
##uvector = rotkit.unitvector(diffvector)[0]
##xyz85 = rotkit.getxyz("%s"%molnameselect85)[0]
##rmat = rotkit.rotmat(rotkit.radangle(10),uvector,xyz85)
##### Copy paste this line into pymol to see it manually
##cmd.transform_selection("%s"%molname,rmat)
##python end
##
##### Now, lets make a function that collects all these call in one function
##### We only want to define two positions that defines the line, the angle and the object to rotate
##python
##rotkit.rotateline("%s"%molnameselect87,"%s"%molnameselect85,180,"%s"%molname)
##python end
##### This is made as a pymol command as well. I first print the names that we should write manually in the consol
##print("rotateline Pos1=%s, Pos2=%s, degangle=15, molecule=%s"%(molnameselect87, molnameselect85, molname))
##
##### To illustate best, we create som copies of the dye
##python
##anglerange = range(90,360,90)
##for angle in anglerange:
##	### Make a suitable name for the new molecule
##	molanglename="%s%s"%(molname,angle)
##	### Now make a copy
##	cmd.create(molanglename,molname)
##	### Rotate the copy
##	rotkit.rotateline("%s"%molnameselect87,"%s"%molnameselect85,angle,"%s"%molanglename)
##python end
##
####### End of PART I ####
####### PART II: More advanced functions #####
##### This view will take you to the second part
##set_view (\
##     0.723298192,    0.467510879,    0.508201897,\
##     0.371686131,   -0.883831143,    0.284063697,\
##     0.581970334,   -0.016570913,   -0.813038886,\
##     0.000000000,    0.000000000,  -76.609786987,\
##    11.790571213,   64.992294312,   20.803859711,\
##   -31.181428909,  184.401092529,  -20.000001907 )
##
##### We can fast mutate a protein. frame 1 is the most probable mutation
##python
##rotkit.mutate(protname, chain="A", resi=513, target="CYS", mutframe=1)
##python end
##### This is made as a pymol command as well. I first print the names that we should write manually in the consol
##print("mutate %s, chain=%s, resi=%s, target=CYS, mutframe=1"%(protname, "A", 515))
##
##### We now make some selections for this mutation
##protselectCBcys="%s and resi 513 and name CB"%protname
##protnameselectCBcys="P513C_CB"
##protselectCAcys="%s and resi 513 and name CA"%protname
##protnameselectCAcys="P513C_CA"
##cmd.select("%s"%protnameselectCBcys,"%s"%protselectCBcys)
##cmd.select("%s"%protnameselectCAcys,"%s"%protselectCAcys)
##
##### Now, lets make a function that collects all the commands to put on an atom on the same line defined by two points
##### The input is the two points that define the line, the atom of a molecule to be put on the line, and the distance to move
##python
##rotkit.toline(protnameselectCAcys,protnameselectCBcys,molnameselect87,molname,3)
##rotkit.rotateline(protnameselectCAcys,protnameselectCBcys,5,molname)
##rotkit.rotateline(molnameselect87,molnameselect85,10,molname)
##python end
##print("toline Pos1=%s, Pos2=%s, atom=%s, molecule=%s, dist=%s"%(protnameselectCAcys,protnameselectCBcys,molnameselect87,molname,3))
##print("rotateline Pos1=%s, Pos2=%s, degangle=5, molecule=%s"%(protnameselectCAcys, protnameselectCBcys, molname))
##print("rotateline Pos1=%s, Pos2=%s, degangle=10, molecule=%s"%(molnameselect87, molnameselect85, molname))
##
####### End of PART II ####
####### Now we make a cross product ####
##molselect88="%s and id 88"%molname
##molnameselect85="dyeatom88"
##cmd.select("%s"%molnameselect88,"%s"%molselect88)
##
##python
##cross = rotkit.crossprod(rotkit.vector(molselect87,molselect85),rotkit.vector(molselect87,molselect88))
###ucross = rotkit.unitvector(cross)[0]
##pcross = rotkit.crosspoint(molselect87,cross)
##rotkit.rotateline(molnameselect87,pcross,10,molname)
##python end
##print("rotateline Pos1=%s, Pos2=%s, degangle=10, molecule=%s"%(molnameselect87, pcross, molname))
rotkit.py
The code can be downloaded fast from here http://tinyurl.com/pymolrotkit
- wget http://tinyurl.com/pymolrotkit
- mv pymolrotkit rotkit.py
#-------------------------------------------------------------------------------
# Name:		rotkit.py   examples
# Purpose:      To rotate molecules easier
#
# Author:      tlinnet
#
# Created:     30/08/2011
# Copyright:   (c) tlinnet 2011
# Licence:     Free
#-------------------------------------------------------------------------------


from pymol import cmd
import math, os
from time import sleep

def printMat(matrix):
	print("%s %s %s %s \n%s %s %s %s \n%s %s %s %s \n%s %s %s %s"%(matrix[0],matrix[1],matrix[2],matrix[3],matrix[4],matrix[5],matrix[6],matrix[7],matrix[8],matrix[9],matrix[10],matrix[11],matrix[12],matrix[13],matrix[14],matrix[15]))
	return None

def getxyz(Sel):
	if type(Sel)==list and len(Sel)==3:
		return Sel, "listXYZ"
	if type(Sel)==str and Sel[0]=="[" and Sel[-1]=="]":
		Selsplit = list(Sel[1:-1].split(","))
		Selsplit = [float(x) for x in Selsplit]
		return Selsplit, "strXYZ"
	if type(Sel)==str:
		pos = cmd.get_atom_coords(Sel)
		return pos, "selXYZ"

def vector(Sel1,Sel2):
	PosSel1 = getxyz(Sel1)[0]
	PosSel2 = getxyz(Sel2)[0]
	vectorcalc = [PosSel2[0]-PosSel1[0],PosSel2[1]-PosSel1[1],PosSel2[2]-PosSel1[2]]
	return(vectorcalc)

def vectoradd(Sel1,Sel2):
	PosSel1 = getxyz(Sel1)[0]
	PosSel2 = getxyz(Sel2)[0]
	vectorcalc = [PosSel1[0]+PosSel2[0],PosSel1[1]+PosSel2[1],PosSel1[2]+PosSel2[2]]
	return(vectorcalc)

def vectorstr(vector):
	return("[%s,%s,%s]"%(vector[0],vector[1],vector[2]))

def transmat(vector,dist=1):
	mat = [1,0,0,0,0,1,0,0,0,0,1,0,dist*vector[0],dist*vector[1],dist*vector[2],1]
	return(mat)

def unitvector(vector):
	vectorlen = math.sqrt(math.pow(vector[0],2)+math.pow(vector[1],2)+math.pow(vector[2],2))
	vectordiv = [vector[0]/vectorlen, vector[1]/vectorlen, vector[2]/vectorlen]
	return(vectordiv,vectorlen)

def radangle(angle):
	return(math.radians(angle))

def rotmat(angle,vectornorm,pointcoord):
	### From: http://inside.mines.edu/~gmurray/ArbitraryAxisRotation/ Section 6.2
	u,v,w = vectornorm
	a,b,c = pointcoord
	makerotmat = [(math.pow(u,2)+(math.pow(v,2)+math.pow(w,2))*math.cos(angle)),
	(u*v*(1-math.cos(angle))-w*math.sin(angle)),
	(u*w*(1-math.cos(angle))+v*math.sin(angle)),
	((a*(math.pow(v,2)+math.pow(w,2))-u*(b*v+c*w))*(1-math.cos(angle))+(b*w-c*v)*math.sin(angle)),
	(u*v*(1-math.cos(angle))+w*math.sin(angle)),
	(math.pow(v,2)+(math.pow(u,2)+math.pow(w,2))*math.cos(angle)),
	(v*w*(1-math.cos(angle))-u*math.sin(angle)),
	((b*(math.pow(u,2)+math.pow(w,2))-v*(a*u+c*w))*(1-math.cos(angle))+(c*u-a*w)*math.sin(angle)),
	(u*w*(1-math.cos(angle))-v*math.sin(angle)),
	(v*w*(1-math.cos(angle))+u*math.sin(angle)),
	(math.pow(w,2)+(math.pow(u,2)+math.pow(v,2))*math.cos(angle)),
	((c*(math.pow(u,2)+math.pow(v,2))-w*(a*u+b*v))*(1-math.cos(angle))+(a*v-b*u)*math.sin(angle)),
	(0),(0),(0),(1),]
	return(makerotmat)

def rotateline(Pos1,Pos2,degangle,molecule):
	diffvector = vector(Pos1,Pos2)
	uvector = unitvector(diffvector)[0]
	xyz = getxyz(Pos2)[0]
	rmat = rotmat(radangle(float(degangle)),uvector,xyz)
	cmd.transform_selection(molecule,rmat)
	return(None)
cmd.extend("rotateline",rotateline)

def mutate(molecule,chain,resi,target="CYS",mutframe="1"):
	target = target.upper()
	cmd.wizard("mutagenesis")
	cmd.do("refresh_wizard")
	cmd.get_wizard().set_mode("%s"%target)
	selection="/%s//%s/%s"%(molecule,chain,resi)
	cmd.get_wizard().do_select(selection)
	cmd.frame(str(mutframe))
	cmd.get_wizard().apply()
	#cmd.set_wizard("done")
	cmd.set_wizard()
	#cmd.refresh()
#### Example in pymol
#python
#MutList = [["5NT","A",308],["5NT","A",513],["5NT","B",513]]
#for p,c,r in MutList:
#    rotkit.mutate(p, chain=c, resi=r, target="CYS", mutframe=1)
### Have do mutate first before selecting, or else it only select the lase?
#for p,c,r in MutList:
#    cmd.select("%s%s%s"%(p,c,r),"/%s//%s/%s"%((p,c,r)))
#python end
cmd.extend("mutate",mutate)

def toline(Pos1,Pos2,atom,molecule,dist=1):
	dist = float(dist)
	diffvector = vector(atom,Pos2)
	move = transmat(diffvector)
	cmd.transform_selection("%s"%molecule,move)
	diffvector = vector(Pos1,Pos2)
	uvector = unitvector(diffvector)[0]
	move = transmat(uvector,dist)
	cmd.transform_selection("%s"%molecule,move)
	return(None)
cmd.extend("toline",toline)

def crossprod(Vector1, Vector2):
	return([Vector1[1]*Vector2[2]-Vector1[2]*Vector2[1], Vector1[2]*Vector2[0]-Vector1[0]*Vector2[2],Vector1[0]*Vector2[1]-Vector1[1]*Vector2[0]])

def crosspoint(Pos1, crossprod):
	Imp1 = getxyz(Pos1)[0]
	Imp2 = getxyz(crossprod)[0]
	return([Imp1[0]+Imp2[0],Imp1[1]+Imp2[1],Imp1[2]+Imp2[2]])

def VectorToMatrix(Vector,MatColRank=4):
	import numpy
	nextrow = range(MatColRank,MatColRank**2,MatColRank)
	rowsall = []
	rowcurrent = []
	for i in range(len(Vector)):
		if i in nextrow:
			rowsall.append(rowcurrent)
			rowcurrent=[]
			rowcurrent.append(Vector[i])
		else:
			rowcurrent.append(Vector[i])
	print rowsall
	return(numpy.matrix(rowsall))

def findMinMax(datalist,index):
	minimum = datalist[0][index]
	maximum = datalist[0][index]
	datacolumn = []
	for l in datalist:
		datacolumn.append(l[index])
		if l[index] < minimum:
			minimum = l[index]
		if l[index] > maximum:
			maximum = l[index]
	return(minimum,maximum,datacolumn)

def makehistogram(datalist,dataname="Histogram",datalistindex=2,nrbins=100,binrange=[0,0]):
	import numpy
	fileout_name= "%s"%dataname +".dat"
	fileout_write = open(fileout_name, "w")
	gnuplot_write = open("%s"%dataname +".plt", "w")
	datacolumnMin, datacolumnMax,datacolumn = findMinMax(datalist,datalistindex)
	if binrange[1]==0:
		xdelta = datacolumnMax-datacolumnMin
		binrange[0] = datacolumnMin-xdelta/2
		binrange[1] = datacolumnMax+xdelta/2
	#print binrange
	(n, binval)=numpy.histogram(datacolumn,bins=int(nrbins),range=(binrange[0],binrange[1]),normed=False)
	binwidthDist = (binrange[1]-binrange[0])/nrbins
	DistHist = []
	### Normalize the histogram
	for i in range(len(n)):
		DistHist.append([binval[i], n[i],float(n[i])/len(datacolumn)])
	#print DistHist
	DistHistMin,DistHistMax,tmp = findMinMax(DistHist,2)
	#print DistHistMin,DistHistMax
	ydelta = DistHistMax-DistHistMin
	### Now write the output
	fileout_write.write("#Datapoints=%s"%len(datacolumn) + "\n");
	fileout_write.write("#Dist[Ang]    Frequency[#]    Probability"+ "\n");
	for dp in DistHist:
		textline = "%4.2f    %5i    %18.5f"%(dp[0], dp[1], dp[2])
		fileout_write.write(textline+"\n")
	gnuplot_write.write('cd "%s"'%os.getcwd() + '\n')
	gnuplot_write.write('set term postscript eps enhanced color' + '\n')
	gnuplot_write.write('' + '\n')
	gnuplot_write.write('set style line 1 lt 1 lw 3 linecolor rgb "red"' + '\n')
	gnuplot_write.write('set style line 2 lt 1 lw 3 linecolor rgb "green"' + '\n')
	gnuplot_write.write('set style line 3 lt 1 lw 3 linecolor rgb "blue"' + '\n')
	gnuplot_write.write('set style line 4 lt 1 lw 3 linecolor rgb "pink"' + '\n')
	gnuplot_write.write('set style line 5 lt 1 lw 0 linecolor rgb "red"' + '\n')
	gnuplot_write.write('binwidthDist=%s'%binwidthDist + '\n')
	gnuplot_write.write('set title "Normalized distance histogram"' + '\n')
	gnuplot_write.write('set xlabel "Distance [Ang]"' + '\n')
	gnuplot_write.write('set xrange[%s:%s]'%(binrange[0],binrange[1]) + '\n')
	gnuplot_write.write('set ylabel "Probability"' + '\n')
	gnuplot_write.write('set yrange[%s:%s]'%(DistHistMin,DistHistMax/binwidthDist) + '\n')
	gnuplot_write.write('set ytics nomirror' + '\n')
	gnuplot_write.write('set y2label "Integrated Bin probability"' + '\n')
	gnuplot_write.write('set y2range[%s:%s]'%(DistHistMin,DistHistMax) + '\n')
	gnuplot_write.write('set y2tics border' + '\n')
	gnuplot_write.write('' + '\n')
	gnuplot_write.write('A=1' + '\n')
	gnuplot_write.write('sigma2=%s'%(xdelta/6.0) + '\n')
	gnuplot_write.write('center=%s'%(datacolumnMin+xdelta/2) + '\n')
	gnuplot_write.write('g(x) = (A*1.0/sqrt(2*pi*sigma2))*exp(-(x-center)**2/(2*sigma2))' + '\n')
	gnuplot_write.write('fit g(x) "%s" using 1:($3/binwidthDist) via sigma2,center'%fileout_name + '\n')
	gnuplot_write.write('' + '\n')
	gnuplot_write.write('set label "g(x)= A*1/(sqrt(2{/Symbol p}{/Symbol s}^2)) * exp(-(x-{/Symbol m})^2/(2{/Symbol s}^2))" at graph 0.05, graph 0.85' + '\n')
	gnuplot_write.write('set label "A= %g", A at graph 0.05, graph 0.80' + '\n')
	gnuplot_write.write('set label "{/Symbol s}= %g", sqrt(sigma2) at graph 0.05, graph 0.75' + '\n')
	gnuplot_write.write('set label "{/Symbol m}= %g", center at graph 0.05, graph 0.70' + '\n')
	gnuplot_write.write('' + '\n')
	gnuplot_write.write('set label "Binwidth= %g", binwidthDist at graph 0.05, graph 0.95' + '\n')
	gnuplot_write.write('set label "Datapoints= %g", '+'%s'%len(datacolumn) + ' at graph 0.05, graph 0.90' + '\n')
	gnuplot_write.write('set output "%s.eps"'%(fileout_name[:-4]) + '\n')
	gnuplot_write.write('plot "%s" using 1:($3/binwidthDist) title "%s" with boxes fs solid 0.4 noborder,\\'%(fileout_name,fileout_name[:-4]) + '\n')
	gnuplot_write.write('g(x) title "Fitted normal distribution g(x)" lw 4,\\' + '\n')
	gnuplot_write.write('"%s" using 1:3 title "" with histeps ls 5 axis x1y2'%fileout_name + '\n')

	fileout_write.close()
	gnuplot_write.close()
	return(DistHist)