Difference between revisions of "RotationAxis"
m |
|||
| (7 intermediate revisions by 3 users not shown) | |||
| Line 1: | Line 1: | ||
{{Infobox script-repo | {{Infobox script-repo | ||
|type = script | |type = script | ||
| − | |filename = | + | |filename = draw_rotation_axis.py |
|author = [[User:PabloGuardado|Pablo Guardado Calvo]] | |author = [[User:PabloGuardado|Pablo Guardado Calvo]] | ||
}} | }} | ||
| − | This script will draw a CGO cylinder representing a rotation axis for a given transformation. | + | This script will draw a CGO cylinder representing a rotation axis for a given transformation. It's very useful for drawing the axes of rotational symmetry in an oligomeric assembly. |
The idea is to align two molecules/domains/chains/selections (using cmd.super) and extract the trasformation (TTT) matrix (T). The direction of the rotation axis, and a point are obtained from T and are used to create a cgo object representing the axis. The script generates two measures: one in the graphical screen (the rotation axis value, and the norm of the translation vector along the rotation axis) and some basic information in the command-line (the transformation matrix, the rotation angle, distance between centroids, and some pml lines that you can use to reproduce the axis...) | The idea is to align two molecules/domains/chains/selections (using cmd.super) and extract the trasformation (TTT) matrix (T). The direction of the rotation axis, and a point are obtained from T and are used to create a cgo object representing the axis. The script generates two measures: one in the graphical screen (the rotation axis value, and the norm of the translation vector along the rotation axis) and some basic information in the command-line (the transformation matrix, the rotation angle, distance between centroids, and some pml lines that you can use to reproduce the axis...) | ||
| Line 13: | Line 13: | ||
To load the script just type: | To load the script just type: | ||
| − | '''run path-to-the-script/draw_rotation_axis.py''' | + | '''run ''path-to-the-script''/draw_rotation_axis.py''' |
or if you want something more permanent add the previous line to your .pymolrc file | or if you want something more permanent add the previous line to your .pymolrc file | ||
| Line 27: | Line 27: | ||
or objects: | or objects: | ||
| − | '''draw_axis('obj01', 'obj02)''' | + | '''draw_axis('obj01', 'obj02')''' |
| − | Also, you can play a bit with the | + | Also, you can play a bit with the length, width and color of the axis. |
'''draw_axis('selection1', 'selection2', scale_factor, width, r1, g1, b1, r2, g2, b2)''' | '''draw_axis('selection1', 'selection2', scale_factor, width, r1, g1, b1, r2, g2, b2)''' | ||
| − | '''scale_factor''' = to control the | + | '''scale_factor''' = to control the length of the axis, the default is 20 |
'''width''' = to control the width of the axis. Default is 0.6 | '''width''' = to control the width of the axis. Default is 0.6 | ||
| − | '''r1, g1, b1''' = first RGB | + | '''r1, g1, b1''' = first RGB color code. Default is 1, 1, 1 |
| − | '''r2, g2, b2''' = second RGB | + | '''r2, g2, b2''' = second RGB color code to create the gradient. Default is 1, 0, 0. |
| − | To create a single | + | To create a single color axis, just made r1,g1,b1=r2,g2,b2 |
= Examples = | = Examples = | ||
<source lang="python"> | <source lang="python"> | ||
| − | # download the source and save as | + | # download the source and save as draw_rotation_axis.py |
run draw_rotation_axis.py | run draw_rotation_axis.py | ||
fetch 2vak | fetch 2vak | ||
| + | # calculate rotation axis between chains A and B | ||
| + | draw_axis('chain A', 'chain B') | ||
| + | </source> | ||
| + | |||
| + | <gallery perrow=3 widths=350 heights=350> | ||
| + | Image:2vak4.png |Rotation axis between chains A and B | ||
| + | Image:2vak2.png |Some basic information is printed in the screen | ||
| + | </gallery> | ||
| + | |||
| + | <source lang="python"> | ||
| + | # Another example, calculate the rotation axis of an homodimer | ||
| + | run draw_rotation_axis.py | ||
| + | fetch 3rfg | ||
# calculate rotation axis between chains A and B | # calculate rotation axis between chains A and B | ||
draw_axis('chain A', 'chain B') | draw_axis('chain A', 'chain B') | ||
| Line 53: | Line 66: | ||
<gallery perrow=3 widths=300 heights=300> | <gallery perrow=3 widths=300 heights=300> | ||
| − | Image: | + | Image:3rfg1.png |Rotation axis between chains A and B |
| − | Image: | + | Image:3rfg4.png |Some basic information is printed in the screen |
</gallery> | </gallery> | ||
| + | |||
| + | <source lang="python"> | ||
| + | # Clearly, each of the domains are made up with motifs with internal symmetry | ||
| + | draw_axis('resi 200-236 and chain A', 'resi 238-274 and chain A', 20, 0.6, 1, 0, 0, 1, 0, 0) | ||
| + | # Also, you can create first the selections and use them to calculate the axis | ||
| + | sele selection1, resi 200-236 and chain A | ||
| + | sele selection2, resi 238-274 and chain A | ||
| + | draw_axis('selection1', 'selection2', 20, 0.6, 1, 0, 0, 1, 0, 0) | ||
| + | # will produce the same result. | ||
| + | </source> | ||
| + | |||
| + | <gallery perrow=3 widths=300 heights=300> | ||
| + | Image:3rfg2.png |Internal rotation axis | ||
| + | Image:3rfg3.png |Some basic information is printed in the screen | ||
| + | </gallery> | ||
| + | |||
[[Category:Script_Library]] | [[Category:Script_Library]] | ||
Latest revision as of 06:18, 21 November 2017
| Type | Python Script |
|---|---|
| Download | draw_rotation_axis.py |
| Author(s) | Pablo Guardado Calvo |
| License | |
| This code has been put under version control in the project Pymol-script-repo | |
This script will draw a CGO cylinder representing a rotation axis for a given transformation. It's very useful for drawing the axes of rotational symmetry in an oligomeric assembly.
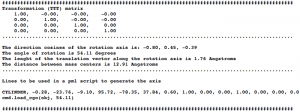
The idea is to align two molecules/domains/chains/selections (using cmd.super) and extract the trasformation (TTT) matrix (T). The direction of the rotation axis, and a point are obtained from T and are used to create a cgo object representing the axis. The script generates two measures: one in the graphical screen (the rotation axis value, and the norm of the translation vector along the rotation axis) and some basic information in the command-line (the transformation matrix, the rotation angle, distance between centroids, and some pml lines that you can use to reproduce the axis...)
As always with these type of things, you have to use it at your own risk. I did not try all possible combinations, but if you find a bug, do not hesitate to contact me (pablo.guardado@gmail.com) or try to modify the code for yourself to correct it.
To load the script just type:
run path-to-the-script/draw_rotation_axis.py
or if you want something more permanent add the previous line to your .pymolrc file
The script works just typing:
draw_axis('selection1', 'selection2')
Please, pay attention to the apostrophes around the selections, you MUST use them. Also works with chains:
draw_axis('chain A', 'chain B')
or objects:
draw_axis('obj01', 'obj02')
Also, you can play a bit with the length, width and color of the axis.
draw_axis('selection1', 'selection2', scale_factor, width, r1, g1, b1, r2, g2, b2)
scale_factor = to control the length of the axis, the default is 20
width = to control the width of the axis. Default is 0.6
r1, g1, b1 = first RGB color code. Default is 1, 1, 1
r2, g2, b2 = second RGB color code to create the gradient. Default is 1, 0, 0.
To create a single color axis, just made r1,g1,b1=r2,g2,b2
Examples
# download the source and save as draw_rotation_axis.py
run draw_rotation_axis.py
fetch 2vak
# calculate rotation axis between chains A and B
draw_axis('chain A', 'chain B')
Rotation axis between chains A and B
Some basic information is printed in the screen


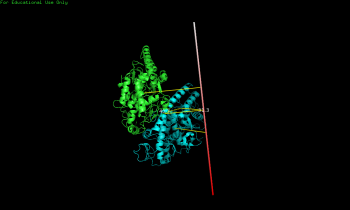
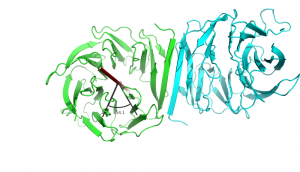
# Another example, calculate the rotation axis of an homodimer
run draw_rotation_axis.py
fetch 3rfg
# calculate rotation axis between chains A and B
draw_axis('chain A', 'chain B')
Rotation axis between chains A and B
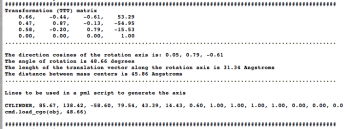
Some basic information is printed in the screen


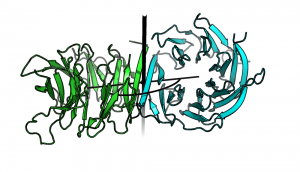
# Clearly, each of the domains are made up with motifs with internal symmetry
draw_axis('resi 200-236 and chain A', 'resi 238-274 and chain A', 20, 0.6, 1, 0, 0, 1, 0, 0)
# Also, you can create first the selections and use them to calculate the axis
sele selection1, resi 200-236 and chain A
sele selection2, resi 238-274 and chain A
draw_axis('selection1', 'selection2', 20, 0.6, 1, 0, 0, 1, 0, 0)
# will produce the same result.
Internal rotation axis
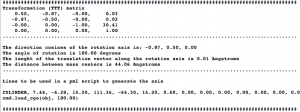
Some basic information is printed in the screen

