Difference between revisions of "PyANM"
| Line 63: | Line 63: | ||
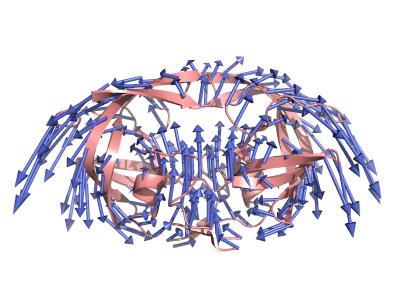
Figure 4 shows the arrows for mode 2 of HIV protease produced by PyANM. | Figure 4 shows the arrows for mode 2 of HIV protease produced by PyANM. | ||
| + | |||
| + | === Export Data === | ||
| + | This will allow you to save data calculated from PyANM to your local system for future processing. You can choose to save eigenvalues (frequencies for modes), eigenvectors (modes), MSFs, contact matrix or hessian matrix from <b>Control Panel</b>. | ||
| + | |||
| + | === Control Panel === | ||
Revision as of 19:05, 19 October 2014
| Type | PyMOL Plugin |
|---|---|
| Download | plugins/pyanm.py |
| Author(s) | Yuan Wang |
| License | - |
| This code has been put under version control in the project Pymol-script-repo | |
Introduction
Elastic Network Models (ENM) have been successful in reproducing fluctuations for proteins of native conformations. ENM is a coarse-grained method for modeling protein dynamics, meaning in generally in ENM each residue is represented by one bead in its Alpha Carbon position. These beads are then connected by elastic springs if the distance between two beads fall under a cutoff value (usually within the range of 7 to 15 angstroms). For more details please read here.
PyANM is developed as a cross-platform Pymol Plugin to allow its users to build and visualize Anisotropic Network Models, a member of the ENM family. This plugin allows its users to draw arrows or make movies based on calculated mode motions, to draw all springs used to build the ANM within the protein, to color the protein based on its Mean Square Fluctuations (MSF) calculated from ANM and to export data from ANM for future processing. PyANM also allows its users to change the colors and scales (sizes) for movies or arrows generated by PyANM for better visualization.
Dependencies
- PyANM requires Numerical Python (NumPy) to do all the matrix calculations. If you wish to use PyANM but don't have NumPy on your machine, please follow the download and build instructions here. If you will be using PyANM on a Windows machine, installing a Python distribution such as Anaconda might be the easier. After installing NumPy, type the following line inside Pymol and if you don't see any error messages, you now have NumPy ready for Pymol!
import numpy
- Having SciPy might improve the performance of PyANM but it is not required.
- PyANM has only been tested for Pymol 1.1 and higher, using an earlier version on Pymol might cause problems.
Installation
Download pyanm.py from this page, then go to Pymol-->Plugin-->Manage Plugins-->Install..., select the file you have just downloaded and then restart Pymol. Things might be different depending on your Pymol version and your local system, but this should be fairly similar.
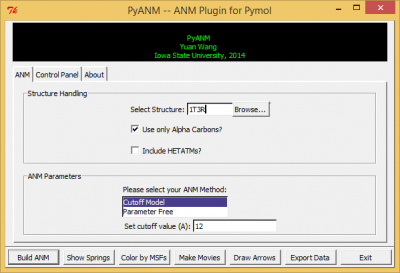
After a successful installation, go to Pymol-->Plugin and you will see PyANM, click on it and you should see PyANM's interface just like in figure 1.
Usage
Now that you have PyANM installed, let's build one ANM together!
Structure Handling
- Type the name of your protein structure under 'Select Structure', this could either be a valid 4-letter PDB (Protein Data Bank) ID or the name of a object you have already loaded into Pymol.
- You could also choose to upload a local file from your system using the 'Browse' button.
- If the check box 'Use only Alpha Carbons' is checked, even if you choose an all-atom structure, PyANM will coarse-grain the structure for you. Otherwise PyANM will build an all-atom ANM if an all-atom structure is used.
- If the check box 'Include HETATMs' is checked, PyANM will include atoms in PDB that starts with HETATM as well.
ANM Parameters
- So far there are two ANMs available in PyANM : the cutoff model as described here and the Parameter Free Model described here, where spring constants are adjusted based on distance between two residues.
- If you choose to use Cutoff Model, you will be able to choose your desired cutoff value. The default value is 12 angstroms, personally I would recommend using any value between 7 angstroms to 15 anstroms.
- If you choose to use Parameter Free Model, you will be able to choose the power t for calculating spring constants for all residue pairs, where spring constant k for residue i and j is calculated as 1/distance(i,j) to the power of t. The default value for power t is 6.
Build ANM
Once you have selected the structure you wish to use as well as the model and its parameters, you should be able to build your ANM simply by clicking 'Build ANM'.A window will pop up telling you your ANM was built successfully once the calculation has finished. For a protein with less than 200 residues, this should take less than 10 seconds.
Show Springs
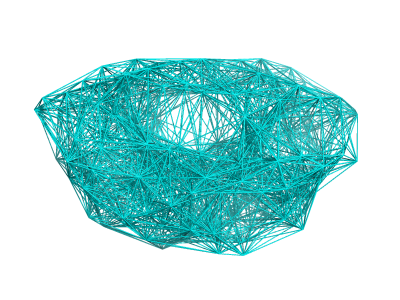
After building your ANM, you will be able to visualize all the springs in Pymol by simply clicking 'Show Springs' in PyANM.
See Figure 2 for a demonstration of all springs for HIV Protease (PDB ID: 1T3R) using cutoff model with cutoff value set as 12 angstroms.
Color by MSFs
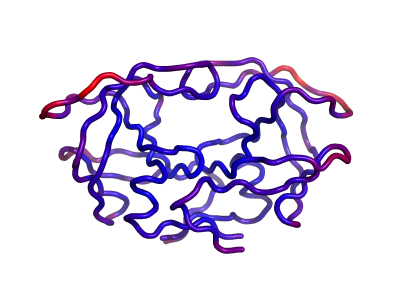
One can also calculate the Mean Square Fluctuations (MSF) with all the modes calculated by ANM. ANM has been successful in getting high correlations between its calculated MSFs and experimental b-factors for most cases. Here PyANM allows you to color the structure based on its calculated MSFs just like Pymol colors a structure with its b-factors. Here the spectrum is from blue to red corresponding to from low values to high values.
Figure 3 shows the same HIV protease in figure 2 colored by its calculated MSFs.
Make Movies
You will be able to make harmonic fluctuation movies for different modes when you click 'Make Movies' after building your ANM. A dialogue will pop up asking for the desired modes you wish to make movies with. Modes are sorted with an ascending frequencies and the first 6 rigid-body modes are already discarded. So modes 1,2,3 will be the first 3 slowest modes.
Draw Arrows
Instead of making movies for different modes, you can also draw arrows for each residue for different modes. Each arrow's direction will point to the direction where the residue will move and each arrow's length will indicate the moving scale for each residue.
Figure 4 shows the arrows for mode 2 of HIV protease produced by PyANM.
Export Data
This will allow you to save data calculated from PyANM to your local system for future processing. You can choose to save eigenvalues (frequencies for modes), eigenvectors (modes), MSFs, contact matrix or hessian matrix from Control Panel.


