|
|
| (11 intermediate revisions by the same user not shown) |
| Line 1: |
Line 1: |
| − | == Author == | + | {{Infobox script-repo |
| − | This pymol script is made by Troels Emtekær Linnet<br />
| + | |type = script |
| | + | |filename = forster_distance_calculator.py |
| | + | |author = [[User:Tlinnet|Troels E. Linnet]] |
| | + | |license = BSD |
| | + | }} |
| | | | |
| | == Introduction == | | == Introduction == |
| Line 8: |
Line 12: |
| | This script does no calculation of proteins in pymol, but is made as a "hack/shortcut" for a python script. <br /> | | This script does no calculation of proteins in pymol, but is made as a "hack/shortcut" for a python script. <br /> |
| | We use the python part of pymol to do the calculations, so a student would not need to install python at home, but simply pymol. <br /> | | We use the python part of pymol to do the calculations, so a student would not need to install python at home, but simply pymol. <br /> |
| − | Make a pymol .pml file like this. Write in the required information, and execute/run the script with pymol. Then open the .plt file afterwards with gnuplot.
| |
| − | <source lang="python">
| |
| − | ## Change to your directory
| |
| − | cd /homes/YOU/Documents/Atto-dyes/Spectre/ALEXA488-ALEXA633
| |
| − | import forster
| |
| − | forster D_Exi=ALEXA488Exi.txt, D_Emi=ALEXA488Emi.txt, A_Exi=ALEXA633Exi.txt, A_Emi=ALEXA633Emi.txt, A_e_Max_Y=159000, A_e_Max_X=621, Qd=0.92
| |
| − | </source>
| |
| | | | |
| | == Spectre input == | | == Spectre input == |
| Line 94: |
Line 91: |
| | == How to run the script == | | == How to run the script == |
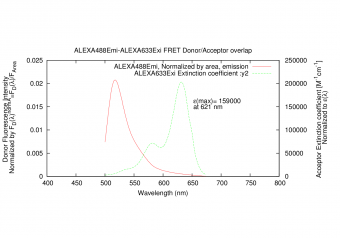
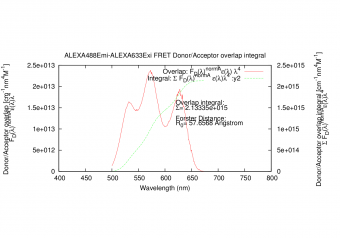
| | Make a pymol .pml file like this. Write in the required information, and execute/run the script with pymol. Then open the .plt file afterwards with gnuplot. | | Make a pymol .pml file like this. Write in the required information, and execute/run the script with pymol. Then open the .plt file afterwards with gnuplot. |
| − | <source lang="python"> | + | <syntaxhighlight lang="python"> |
| | ## Change to your directory | | ## Change to your directory |
| | cd /homes/YOU/Documents/Atto-dyes/Spectre/ALEXA488-ALEXA633 | | cd /homes/YOU/Documents/Atto-dyes/Spectre/ALEXA488-ALEXA633 |
| − | import forster | + | import forster_distance_calculator |
| | forster D_Exi=ALEXA488Exi.txt, D_Emi=ALEXA488Emi.txt, A_Exi=ALEXA633Exi.txt, A_Emi=ALEXA633Emi.txt, A_e_Max_Y=159000, A_e_Max_X=621, Qd=0.92 | | forster D_Exi=ALEXA488Exi.txt, D_Emi=ALEXA488Emi.txt, A_Exi=ALEXA633Exi.txt, A_Emi=ALEXA633Emi.txt, A_e_Max_Y=159000, A_e_Max_X=621, Qd=0.92 |
| − | </source> | + | </syntaxhighlight> |
| − | | |
| − | == Python Code: forster.py ==
| |
| − | The code can be downloaded fast from here http://tinyurl.com/pymolforster <br />
| |
| − | # wget http://tinyurl.com/pymolforster
| |
| − | # mv pymolforster forster.py
| |
| − | <source lang="python">
| |
| − | try: from pymol import cmd; runningpymol='yes'
| |
| − | except: runningpymol='no'; pass
| |
| − | import os, platform, math
| |
| − | | |
| − | #-------------------------------------------------------------------------------
| |
| − | # Name: Forster
| |
| − | # Purpose: Forster resonance energy transfer calculator.
| |
| − | # Input is manufactor provided spectres of Donor emission and
| |
| − | # acceptor excitation spectrum.
| |
| − | #
| |
| − | # Carl Boswell and co. have made a new homepage with a long list of dyes which can be downloaded.
| |
| − | # With a graphics program, they have traced several spectre of dyes from the literature and made this easily public at:
| |
| − | # http://www.spectra.arizona.edu/ I highly recommend this homepage.
| |
| − | # With these Spectra, the script can calculate the Forster Distance for different dyes from different companies.
| |
| − | # Download "one spectrum at the time" by "deselecting" one of the spectre in the right side of the graph window.
| |
| − | # Then get the datafile with the button in the lower right corner.
| |
| − | ##
| |
| − | # Made from
| |
| − | # http://en.wikipedia.org/wiki/F%C3%B6rster_resonance_energy_transfer#Theoretical_basis
| |
| − | # {R_0}^6 = \frac{9\,Q_0 \,(\ln 10) \kappa^2 \, J}{128 \, \pi^5 \,n^4 \, N_A}
| |
| − | #
| |
| − | # Author: Troels Emtekaer Linnet: tlinnet@gmail.com
| |
| − | #
| |
| − | # Created: 29/03/2011
| |
| − | # Copyright: (c) tlinnet 2011
| |
| − | # Licence: Free for all
| |
| − | #-------------------------------------------------------------------------------
| |
| − | #Ref(1)
| |
| − | # Biochemistry 1997, 36, 11261-11272
| |
| − | # M. Pilar Lillo, Joseph M. Beechem, Barbara K. Szpikowska, Mark A. Sherman, and Maria T. Mas
| |
| − | #Design and Characterization of a Multisite Fluorescence Energy-Transfer System for Protein Folding Studies: A Steady-State and Time-Resolved Study of Yeast Phosphoglycerate Kinase
| |
| − | #
| |
| − | # NOTES:
| |
| − | # Datafiles: Two column file. Space separated. Numbers are "." dot noted. First column is in nanometers nm. Second column is arbitrary units of fluorescence/emission.
| |
| − | # If you have collected Donor Exitation and Acceptor Emission, they can be collected and plotted in gnuplot automatically. Set: Compare"yes"
| |
| − | | |
| − | # xunit="nm": Enter x values in "nm" or "cm".
| |
| − | # A_e_Max_Y : Acceptor maximum molar extinction coefficient. In units of M-1 cm-1. Approx 60000 - 1500000
| |
| − | # A_e_Max_X : Enter at which wavelength (in nm) the maximum absorption occurs.
| |
| − | # Qd=0.8 : Fluorescence quantum yield of the donor in the absence of the acceptor. Qd = neta_fl = n_fl / n_abs = n_emi / n_exi
| |
| − | # k2 = 2.0/3.0 Dipole orientation factor.
| |
| − | # n = 1.33 : Refractive index of the medium. water=1.33, protein=1.4, n2MGuHCl=1.375 Ref(1)
| |
| − | # NA = 6.02214179e+023 # (units: Number*mol-1 )Avogadros number
| |
| − | | |
| − | def forster(D_Exi="ATTO488Exi.txt",D_Emi="ATTO488Emi.txt",A_Exi="ATTO590Exi.txt",A_Emi="ATTO590Emi.txt",A_e_Max_Y=120000,A_e_Max_X=594,Qd=0.8,k2=0.66667,n=1.33,Compare="yes",xunit="nm"):
| |
| − | A_e_Max_Y=float(A_e_Max_Y);A_e_Max_X=float(A_e_Max_X);Qd=float(Qd);k2=float(k2);n=float(n);NA=6.02214179e+023
| |
| − | print k2, Qd
| |
| − | printAll = "ye" # To print out all info
| |
| − | fileDexi, extDexi = os.path.splitext(D_Exi)
| |
| − | fileDemi, extDemi = os.path.splitext(D_Emi)
| |
| − | fileAexi, extAexi = os.path.splitext(A_Exi)
| |
| − | fileAemi, extAemi = os.path.splitext(A_Emi)
| |
| − | overlapname = fileDemi+"-"+fileAexi+"-overlap.dat"
| |
| − | overlapfile = open(overlapname, "w")
| |
| − | overlapgnuplotname = fileDemi+"-"+fileAexi+"-overlap.plt"
| |
| − | overlapgnuplotfile = open(overlapgnuplotname, "w")
| |
| − | print "\nI have opened two files for you: \n%s and %s" % (overlapname,overlapgnuplotname)
| |
| − | print "The .plt should be opened with gnuplot to make the graphs."
| |
| − | print "The created graphs are .eps files."
| |
| − | print "They can be converted to pdf with the program: epstopdf or eps2pdf"
| |
| − | print 'Part of LaTeX: C:\Program Files (x86)\MiKTeX 2.9\miktex'+"\\"+"bin"
| |
| − | print "Or download here: http://tinyurl.com/eps2pdf"
| |
| − | | |
| − | DonorEmi = open(D_Emi, "r")
| |
| − | AcceptorExi = open(A_Exi, "r")
| |
| − | lineDemi = DonorEmi.readlines()
| |
| − | lineAexi = AcceptorExi.readlines()
| |
| − | Demi = []
| |
| − | Aexi = []
| |
| − | | |
| − | for i in lineDemi:
| |
| − | if not i.strip(): #If line cannot get stripped(does not exist), then continue
| |
| − | continue
| |
| − | else: #If line can get stripped
| |
| − | if testfloat(str.split(i)[0]):
| |
| − | Demi.append([float(str.split(i)[0]), float(str.split(i)[1])])
| |
| − | AreaDemi = numintegrator(Demi)
| |
| − | print "Nummerical integration of Donor emission spectrum, used for normalization, gives: Area=",AreaDemi
| |
| − | | |
| − | for i in lineAexi:
| |
| − | if not i.strip():
| |
| − | continue
| |
| − | else:
| |
| − | if testfloat(str.split(i)[0]):
| |
| − | Aexi.append([float(str.split(i)[0]), float(str.split(i)[1])])
| |
| − | if float(str.split(i)[0]) == float(A_e_Max_X):
| |
| − | Epsiloncorrection = [float(A_e_Max_X), float(str.split(i)[0]), float(str.split(i)[1])]
| |
| − | | |
| − | # Making the overlap
| |
| − | OverlapDataPoints = []
| |
| − | OverlapSum = 0.0
| |
| − | # For comparing two floating numbers, one have to be carefully. Setting error allowing difference
| |
| − | eallow = 0.00000001
| |
| − | for i in range(len(Demi)):
| |
| − | for j in range(len(Aexi)):
| |
| − | if Demi[i][0]-eallow < Aexi[j][0] and Demi[i][0]+eallow > Aexi[j][0]:
| |
| − | Overlap = (Demi[i][1]*Aexi[j][1]*float(A_e_Max_Y)*math.pow(Demi[i][0],4))/(AreaDemi*Epsiloncorrection[2])
| |
| − | OverlapSum = OverlapSum + Overlap
| |
| − | OverlapDataPoints.append([Demi[i][0], Demi[i][1], Aexi[j][0], Aexi[j][1], Overlap, OverlapSum])
| |
| − | | |
| − | AreaOverlap = numintegrator(OverlapDataPoints,0,4)
| |
| − | Prefactor = ForsterPrefactor6(Qd,k2,n,NA,printAll)
| |
| − | ForsterAng = ForsterCalc(Prefactor,AreaOverlap,xunit,printAll)
| |
| − | | |
| − | # Outputting data
| |
| − | overlapfile.write("Emi-wavelength Emi-value-norm1 Emi-value-normA Exi-wavelength Exi-value-norm1 Exti-coefficient Overlap Overlap-Sum\n");
| |
| − | for line in range(len(OverlapDataPoints)):
| |
| − | textline = "%4.1f %24.4f %15.4e %14.1f %15.4e %16.4e %12.4e %13.4e"%(OverlapDataPoints[line][0],OverlapDataPoints[line][1],float(OverlapDataPoints[line][1]/AreaDemi),OverlapDataPoints[line][2],OverlapDataPoints[line][3],float(A_e_Max_Y*OverlapDataPoints[line][3]/Epsiloncorrection[2]),float(OverlapDataPoints[line][4]),float(OverlapDataPoints[line][5]))
| |
| − | overlapfile.write(textline+"\n")
| |
| − | | |
| − | #Make gnuplot plot file
| |
| − | overlapgnuplotfile.write("reset" + "\n")
| |
| − | overlapgnuplotfile.write("cd "+"'"+os.getcwd()+"'"+"\n")
| |
| − | overlapgnuplotfile.write("\n")
| |
| − | overlapgnuplotfile.write("set xrange [400:800]"+"\n")
| |
| − | overlapgnuplotfile.write("set ytics nomirror"+"\n")
| |
| − | overlapgnuplotfile.write("set y2tics"+"\n")
| |
| − | if xunit == "cm": overlapgnuplotfile.write("set xlabel 'Wavelength (cm)'"+"\n")
| |
| − | else: overlapgnuplotfile.write("set xlabel 'Wavelength (nm)'"+"\n")
| |
| − | overlapgnuplotfile.write("set size ratio 0.5"+"\n")
| |
| − | overlapgnuplotfile.write("\n")
| |
| − | overlapgnuplotfile.write("A_e_Max_Y = "+str(A_e_Max_Y)+"\n")
| |
| − | overlapgnuplotfile.write("A_e_Max_X = "+str(A_e_Max_X)+"\n")
| |
| − | overlapgnuplotfile.write("AreaDemi = "+str(AreaDemi)+"\n")
| |
| − | overlapgnuplotfile.write("AreaOverlap = "+str(AreaOverlap)+"\n")
| |
| − | overlapgnuplotfile.write("ForsterAng= "+str(ForsterAng)+"\n")
| |
| − | overlapgnuplotfile.write("\n")
| |
| − | if Compare == "yes":
| |
| − | overlapgnuplotfile.write("#########################Graph 1#############################"+"\n")
| |
| − | overlapgnuplotfile.write('set title '+'"'+fileDemi+"-"+fileAexi+' FRET Donor/Acceptor spectre"'+"\n")
| |
| − | overlapgnuplotfile.write('set ylabel "Donor Fluorescence Intensity F_{D}({/Symbol l}) \\n Acceptor Extinction coefficient {/Symbol e}({/Symbol l})"'+"\n")
| |
| − | overlapgnuplotfile.write('set y2label "F_{D}({/Symbol l}){/Symbol e}({/Symbol l})^{norm1}{/Symbol l}^{4}"'+"\n")
| |
| − | overlapgnuplotfile.write("\n")
| |
| − | overlapgnuplotfile.write('set label 1 "Donor Emission Area= %g", AreaDemi at graph 0.7, -0.15'+"\n")
| |
| − | overlapgnuplotfile.write("\n")
| |
| − | overlapgnuplotfile.write('set term postscript eps enhanced color'+"\n")
| |
| − | overlapgnuplotfile.write('set output '+'"1-'+fileDemi+"-"+fileAexi+'-overlap-all-spectre.eps"'+"\n")
| |
| − | overlapgnuplotfile.write('plot '+'"'+fileDexi+extDexi+'" using 1:2 title '+'"'+fileDexi+' exitation" with lines,\\'+"\n")
| |
| − | # overlapgnuplotfile.write('"'+overlapname+'" using 1:2 title '+'"'+fileDemi+' emission" with lines,\\'+"\n")
| |
| − | # overlapgnuplotfile.write('"'+overlapname+'" using 4:5 title '+'"'+fileAexi+' exitation" with lines,\\'+"\n")
| |
| − | overlapgnuplotfile.write('"'+fileDemi+extDemi+'" using 1:2 title '+'"'+fileDemi+' emission" with lines,\\'+"\n")
| |
| − | overlapgnuplotfile.write('"'+fileAexi+extAexi+'" using 1:2 title '+'"'+fileAexi+' exitation" with lines,\\'+"\n")
| |
| − | overlapgnuplotfile.write('"'+fileAemi+extAemi+'" using 1:2 title '+'"'+fileAemi+' emission" with lines,\\'+"\n")
| |
| − | overlapgnuplotfile.write('"'+overlapname+'" using 1:($2*$5*$1**4) title "D/A Overlap :y2" with lines axis x1y2'+"\n")
| |
| − | overlapgnuplotfile.write("\n")
| |
| − | overlapgnuplotfile.write("## Show in window, x11 for Linux"+"\n")
| |
| − | overlapgnuplotfile.write("#set term x11"+"\n")
| |
| − | overlapgnuplotfile.write("#set term windows"+"\n")
| |
| − | overlapgnuplotfile.write("#replot"+"\n")
| |
| − | overlapgnuplotfile.write("#pause -1"+"\n")
| |
| − | overlapgnuplotfile.write("unset label"+"\n")
| |
| − | overlapgnuplotfile.write("\n")
| |
| − | overlapgnuplotfile.write("#########################Graph 2#############################"+"\n")
| |
| − | overlapgnuplotfile.write('set title '+'"'+fileDemi+"-"+fileAexi+' FRET Donor/Acceptor overlap"'+"\n")
| |
| − | overlapgnuplotfile.write('set ylabel "Donor Fluorescence Intensity \\n Normalized by F_{D}({/Symbol l})^{normA}=F_{D}({/Symbol l})/F_{Area}"'+"\n")
| |
| − | overlapgnuplotfile.write('set y2label "Acceptor Extinction coefficient [M^{-1}cm^{-1}] \\n Normalized to {/Symbol e}({/Symbol l})"'+"\n")
| |
| − | overlapgnuplotfile.write("\n")
| |
| − | overlapgnuplotfile.write('set label 1 "{/Symbol e}(max)= %g", A_e_Max_Y at graph 0.63, 0.65'+"\n")
| |
| − | overlapgnuplotfile.write('set label 2 "at %g '+xunit+'", A_e_Max_X at graph 0.63, 0.60'+"\n")
| |
| − | overlapgnuplotfile.write("\n")
| |
| − | overlapgnuplotfile.write('set term postscript eps enhanced color'+"\n")
| |
| − | overlapgnuplotfile.write('set output '+'"2-'+fileDemi+"-"+fileAexi+'-overlap-normalized-spectre.eps"'+"\n")
| |
| − | overlapgnuplotfile.write('plot '+'"'+overlapname+'" using 1:3 title '+'"'+fileDemi+', Normalized by area, emission" with lines,\\'+"\n")
| |
| − | overlapgnuplotfile.write('"'+overlapname+'" using 4:6 title '+'"'+fileAexi+' Extinction coefficient :y2" with lines axis x1y2'+"\n")
| |
| − | overlapgnuplotfile.write("\n")
| |
| − | overlapgnuplotfile.write("## Show in window, x11 for Linux"+"\n")
| |
| − | overlapgnuplotfile.write("#set term x11"+"\n")
| |
| − | overlapgnuplotfile.write("#set term windows"+"\n")
| |
| − | overlapgnuplotfile.write("#replot"+"\n")
| |
| − | overlapgnuplotfile.write("#pause -1"+"\n")
| |
| − | overlapgnuplotfile.write("unset label"+"\n")
| |
| − | overlapgnuplotfile.write("\n")
| |
| − | overlapgnuplotfile.write("#########################Graph 3#############################"+"\n")
| |
| − | overlapgnuplotfile.write('set title '+'"'+fileDemi+"-"+fileAexi+' FRET Donor/Acceptor overlap integral"'+"\n")
| |
| − | if xunit == "cm":
| |
| − | overlapgnuplotfile.write('set ylabel "Donor/Acceptor overlap [cm^{3}M^{-1}] \\n F_{D}({/Symbol l})^{normA}{/Symbol e}({/Symbol l}){/Symbol l}^{4}"'+"\n")
| |
| − | overlapgnuplotfile.write('set y2label "Donor/Acceptor overlap integral [cm^{3}M^{-1}] \\n {/Symbol S} F_{D}({/Symbol l})^{normA}{/Symbol e}({/Symbol l}){/Symbol l}^{4}"'+"\n")
| |
| − | | |
| − | else:
| |
| − | overlapgnuplotfile.write('set ylabel "Donor/Acceptor overlap [cm^{-1}nm^{4}M^{-1}] \\n F_{D}({/Symbol l})^{normA}{/Symbol e}({/Symbol l}){/Symbol l}^{4}"'+"\n")
| |
| − | overlapgnuplotfile.write('set y2label "Donor/Acceptor overlap integral [cm^{-1}nm^{4}M^{-1}] \\n {/Symbol S} F_{D}({/Symbol l})^{normA}{/Symbol e}({/Symbol l}){/Symbol l}^{4}"'+"\n")
| |
| − | overlapgnuplotfile.write("\n")
| |
| − | overlapgnuplotfile.write('set label 1 "Overlap integral:" at graph 0.55, 0.65'+"\n")
| |
| − | overlapgnuplotfile.write('set label 2 "{/Symbol S}= %g", AreaOverlap at graph 0.55, 0.60'+"\n")
| |
| − | overlapgnuplotfile.write('set label 3 "Forster Distance:" at graph 0.55, 0.50'+"\n")
| |
| − | overlapgnuplotfile.write('set label 5 "R_{0}= %g Angstrom", ForsterAng at graph 0.55, 0.45'+"\n")
| |
| − | overlapgnuplotfile.write("\n")
| |
| − | overlapgnuplotfile.write('set term postscript eps enhanced color'+"\n")
| |
| − | overlapgnuplotfile.write('set output '+'"3-'+fileDemi+"-"+fileAexi+'-overlap-integral.eps"'+"\n")
| |
| − | overlapgnuplotfile.write('plot '+'"'+overlapname+'" using 1:7 title "Overlap: F_{D}({/Symbol l})^{normA}{/Symbol e}({/Symbol l}) {/Symbol l}^{4}" with lines,\\'+"\n")
| |
| − | overlapgnuplotfile.write('"'+overlapname+'" using 1:8 title "Integral: {/Symbol S} F_{D}({/Symbol l})^{normA} {/Symbol e}({/Symbol l}){/Symbol l}^{4} :y2" with lines axis x1y2'+"\n")
| |
| − | overlapgnuplotfile.write("\n")
| |
| − | overlapgnuplotfile.write("## Show in window, x11 for Linux"+"\n")
| |
| − | overlapgnuplotfile.write("#set term x11"+"\n")
| |
| − | overlapgnuplotfile.write("#set term windows"+"\n")
| |
| − | overlapgnuplotfile.write("#replot"+"\n")
| |
| − | overlapgnuplotfile.write("#pause -1"+"\n")
| |
| − | overlapgnuplotfile.write("unset label")
| |
| − | | |
| − | overlapgnuplotfile.close()
| |
| − | overlapfile.close()
| |
| − | return(ForsterAng)
| |
| − | if runningpymol !='no': cmd.extend("forster",forster)
| |
| − | | |
| − | def ForsterConstFactor6(NA,printAll):
| |
| − | vForsterConstFactor6 = (9*math.log(10))/(128*math.pow(math.pi,5)*NA)
| |
| − | if printAll == 'yes': print "Forster constant pre-factor is:", str(vForsterConstFactor6), "(units: mol)"
| |
| − | return vForsterConstFactor6
| |
| − | | |
| − | def ForsterVariableFactor6(Qd,k2,n,printAll):
| |
| − | vForsterVariableFactor6 = (k2*Qd)/(math.pow(n,4))
| |
| − | if printAll == 'yes': print "Forster variable pre-factor is:", str(vForsterVariableFactor6), "(units: NIL)"
| |
| − | return vForsterVariableFactor6
| |
| − | | |
| − | def ForsterPrefactor6(Qd,k2,n,NA,printAll):
| |
| − | vForsterPrefactor6 = ForsterConstFactor6(NA,printAll)*ForsterVariableFactor6(Qd,k2,n,printAll)
| |
| − | if printAll == 'yes': print "Forster pre-factor is:", str(vForsterPrefactor6), "(units: mol)"
| |
| − | return vForsterPrefactor6
| |
| − | | |
| − | def ForsterCalcnm(fFPreFactor6, fAreaOverlap,printAll):
| |
| − | if printAll == 'yes': print "Overlap sum is: ", str(fAreaOverlap), "(units: cm-1 nm^4 L mol-1)"
| |
| − | Forster6 = fFPreFactor6*fAreaOverlap
| |
| − | if printAll == 'yes': print "Forster distance 6th power:", str(Forster6), "(units: cm-1 nm^4 L), obs(1L=1e-3m^3)"
| |
| − | Forster6m = Forster6*100*math.pow(1e-9,4)*1e-3 #1e-3 is conversion from 1L = 1e-3 m3
| |
| − | if printAll == 'yes': print "Forster distance 6th power:", str(Forster6m), "(units: meter m^6)"
| |
| − | Forster6Ang = Forster6m*math.pow(1e10, 6.0)
| |
| − | if printAll == 'yes': print "Forster distance Angstrom 6th power:", "%e" % (Forster6Ang), "(units: Angstrom^6)"
| |
| − | ForsterAng = math.pow(Forster6Ang, 1.0/6.0)
| |
| − | print "Forster distance:", str(ForsterAng), "(units: Angstrom)"
| |
| − | return ForsterAng
| |
| − | | |
| − | def ForsterCalccm(fFPreFactor6, fAreaOverlap,printAll):
| |
| − | if printAll == 'yes': print "Overlap sum is: ", str(fAreaOverlap), "(units: cm^3 L mol-1)"
| |
| − | Forster6 = fFPreFactor6*fAreaOverlap
| |
| − | if printAll == 'yes': print "Forster distance 6th power:", str(Forster6), "(units: cm^3 L), obs(1L=1e-3m^3)"
| |
| − | Forster6m = Forster6*math.pow(1e-2,3)*1e-3 #1e-3 is conversion from 1L = 1e-3 m3
| |
| − | if printAll == 'yes': print "Forster distance 6th power:", str(Forster6m), "(units: meter m^6)"
| |
| − | Forster6cm = Forster6m*math.pow(1e2, 6.0)
| |
| − | if printAll == 'yes': print "Forster distance cm 6th power:", "%e" % (Forster6cm), "(units: cm^6)"
| |
| − | Forster6Ang = Forster6m*math.pow(1e10, 6.0)
| |
| − | if printAll == 'yes': print "Forster distance Angstrom 6th power:", "%e" % (Forster6Ang), "(units: Angstrom^6)"
| |
| − | ForsterAng = math.pow(Forster6m, 1.0/6.0)
| |
| − | print "Forster distance:", str(ForsterAng), "(units: Angstrom)"
| |
| − | return ForsterAng
| |
| − | | |
| − | def ForsterCalc(fFPreFactor6, fAreaOverlap,xunit,printAll):
| |
| − | if xunit == "nm":
| |
| − | Value = ForsterCalcnm(fFPreFactor6, fAreaOverlap,printAll)
| |
| − | if xunit == "cm":
| |
| − | Value = ForsterCalccm(fFPreFactor6, fAreaOverlap,printAll)
| |
| − | return Value
| |
| − | | |
| − | def testfloat(x):
| |
| − | try:
| |
| − | v=float(x)
| |
| − | return x
| |
| − | except:
| |
| − | return False
| |
| − | | |
| − | def numintegrator(fluarray, col1=0, col2=1):
| |
| − | xprev = 0; xpres = 0; yprev = 0; ypres = 0; summing = 0
| |
| − | for i in range(len(fluarray)):
| |
| − | # Have to skip first datapoint
| |
| − | if i > 0:
| |
| − | xprev = xpres; yprev = ypres
| |
| − | xpres = fluarray[i][col1]; ypres = fluarray[i][col2]
| |
| − | summing = yprev*(xpres-xprev)+(ypres-yprev)*(xpres-xprev)/2.0 + summing
| |
| − | else:
| |
| − | xpres = fluarray[i][col1]; ypres = fluarray[i][col2]
| |
| − | return summing
| |
| − | </source>
| |
| | | | |
| | [[Category:Script_Library]] | | [[Category:Script_Library]] |
| | [[Category:Biochemical_Scripts]] | | [[Category:Biochemical_Scripts]] |
| | + | [[Category:Pymol-script-repo]] |