|
|
| (19 intermediate revisions by 7 users not shown) |
| Line 1: |
Line 1: |
| − | ===DESCRIPTION=== | + | {{Infobox script-repo |
| | + | |type = plugin |
| | + | |filename = plugins/dynoplot.py |
| | + | |author = [[User:Tmwsiy|Dan Kulp]] |
| | + | |license = - |
| | + | }} |
| | + | == Introduction == |
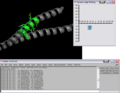
| | This script was setup to do generic plotting, that is given a set of data and axis labels it would create a plot. Initially, I had it setup to draw the plot directly in the PyMol window (allowing for both 2D and 3D style plots), but because I couldn't figure out how to billboard CGO objects (Warren told me at the time that it couldn't be done) I took a different approach. The plot now exists in it's own window and can only do 2D plots. It is however interactive. I only have here a Rama.(phi,psi) plot, but the code can be easily extended to other types of data. For instance, I had this working for an energy vs distance data that I had generated by another script. | | This script was setup to do generic plotting, that is given a set of data and axis labels it would create a plot. Initially, I had it setup to draw the plot directly in the PyMol window (allowing for both 2D and 3D style plots), but because I couldn't figure out how to billboard CGO objects (Warren told me at the time that it couldn't be done) I took a different approach. The plot now exists in it's own window and can only do 2D plots. It is however interactive. I only have here a Rama.(phi,psi) plot, but the code can be easily extended to other types of data. For instance, I had this working for an energy vs distance data that I had generated by another script. |
| | | | |
| Line 5: |
Line 11: |
| | | | |
| | ===IMAGES=== | | ===IMAGES=== |
| − | [[Image:RamaPlotInitComposite.png|thumb|left|Initial Ramachandran plot of 1ENV]]
| + | <gallery> |
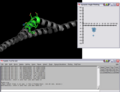
| − | [[Image:RamaPlotBentComposite.png|thumb|left|Modified pose and plot of 1ENV]]
| + | Image:RamaPlotInitComposite.png|Initial Ramachandran plot of 1ENV |
| − | | + | Image:RamaPlotBentComposite.png|Modified pose and plot of 1ENV |
| − | | + | </gallery> |
| − | | |
| − | | |
| − | | |
| − | | |
| − | | |
| − | | |
| − | | |
| − | | |
| − | | |
| − | | |
| − | | |
| − | | |
| − | | |
| − | | |
| − | | |
| | | | |
| | ===SETUP=== | | ===SETUP=== |
| − | place the DynoPlot.py script into PYMOL_PATH/modules/pmg_tk/startup/ , where PYMOL_PATH on Windows is defaulted to C:/Program Files/DeLano Scientific/PyMol/
| + | Install from the plugins menu with ''Plugin > Manage Plugins > Install ...'' or just [[run]] the script. |
| − | start/restart PyMol
| |
| | | | |
| | ===NOTES / STATUS=== | | ===NOTES / STATUS=== |
| − | Tested on Windows, PyMol version 0.97 | + | *Tested on Linux, PyMol version 1.4 |
| − | This is an initial version, which needs some work.
| + | *Left, Right mouse buttons do different things; Right = identify data point, Left = drag data point around |
| − | Post comments/questions or send them to: dwkulp@mail.med.upenn.edu | + | *Post comments/questions or send them to: dwkulp@mail.med.upenn.edu |
| | | | |
| | ===USAGE=== | | ===USAGE=== |
| − | rama SELECTION | + | |
| | + | rama [ sel [, name [, symbols [, filename ]]]] |
| | | | |
| | ===EXAMPLES=== | | ===EXAMPLES=== |
| − | load pdb file 1ENV (download it or use the PDB loader plugin)
| + | |
| − | select resi 129-136 | + | <source lang="python"> |
| | + | fetch 1ENV, async=0 # (download it or use the PDB loader plugin) |
| | + | select sel01, resi 129-136 |
| | rama sel01 | | rama sel01 |
| | rock # the object needs to be moving in order for the angles to be updated. | | rock # the object needs to be moving in order for the angles to be updated. |
| | + | </source> |
| | | | |
| − | ===REFERENCES===
| + | Don't create callback object, use symbols by secondary structure and dump canvas as postscript file: |
| − | | |
| − | ===SCRIPTS (WFMesh.py)===
| |
| − | DynoPlot.py
| |
| − | <source lang="python">
| |
| − | #!/usr/bin/env python
| |
| − | ###############################################
| |
| − | # File: DynoPlot.py
| |
| − | # Author: Dan Kulp
| |
| − | # Creation Date: 8/29/05
| |
| − | #
| |
| − | # Notes:
| |
| − | # Draw plots that display interactive data.
| |
| − | # Phi,Psi plot shown.
| |
| − | ###############################################
| |
| − | | |
| − | | |
| − | from __future__ import division
| |
| − | from __future__ import generators
| |
| − | | |
| − | import os,math
| |
| − | import Tkinter
| |
| − | from Tkinter import *
| |
| − | import Pmw
| |
| − | import distutils.spawn # used for find_executable
| |
| − | import random
| |
| − | from pymol import cmd
| |
| − | | |
| − | try:
| |
| − | import pymol
| |
| − | REAL_PYMOL = True
| |
| − | except ImportError:
| |
| − | print "Nope"
| |
| − | | |
| − | canvas = None
| |
| − | init = 0
| |
| − | | |
| − | class SimplePlot(Tkinter.Canvas):
| |
| − | | |
| − | # Class variables
| |
| − | mark = 'Oval' # Only 'Oval' for now..
| |
| − | mark_size = 5
| |
| − | xlabels = [] # axis labels
| |
| − | ylabels = []
| |
| − | spacingx = 0 # spacing in x direction
| |
| − | spacingy = 0
| |
| − | xmin = 0 # min value from each axis
| |
| − | ymin = 0
| |
| − | lastx = 0 # previous x,y pos of mouse
| |
| − | lasty = 0
| |
| − | down = 0 # flag for mouse pressed
| |
| − | item = (0,) # items array used for clickable events
| |
| − | shapes = {} # store plot data, x,y etc..
| |
| − | | |
| − | def axis(self,xmin=40,xmax=300,ymin=10,ymax=290,xint=290,yint=40,xlabels=[],ylabels=[]):
| |
| − | | |
| − | # Store variables in self object
| |
| − | self.xlabels = xlabels
| |
| − | self.ylabels = ylabels
| |
| − | self.spacingx = (xmax-xmin) / (len(xlabels) - 1)
| |
| − | self.spacingy = (ymax-ymin) / (len(ylabels) - 1)
| |
| − | self.xmin = xmin
| |
| − | self.ymin = ymin
| |
| − | | |
| − | # Create axis lines
| |
| − | self.create_line((xmin,xint,xmax,xint),fill="black",width=3)
| |
| − | self.create_line((yint,ymin,yint,ymax),fill="black",width=3)
| |
| − | | |
| − | # Create tick marks and labels
| |
| − | nextspot = xmin
| |
| − | for label in xlabels:
| |
| − | self.create_line((nextspot, xint+5,nextspot, xint-5),fill="black",width=2)
| |
| − | self.create_text(nextspot, xint-15, text=label)
| |
| − | if len(xlabels) == 1:
| |
| − | nextspot = xmax
| |
| − | else:
| |
| − | nextspot = nextspot + (xmax - xmin)/ (len(xlabels) - 1)
| |
| − | | |
| − | | |
| − | nextspot = ymax
| |
| − | for label in ylabels:
| |
| − | self.create_line((yint+5,nextspot,yint-5,nextspot),fill="black",width=2)
| |
| − | self.create_text(yint-20,nextspot,text=label)
| |
| − | if len(ylabels) == 1:
| |
| − | nextspot = ymin
| |
| − | else:
| |
| − | nextspot = nextspot - (ymax - ymin)/ (len(ylabels) - 1)
| |
| − | | |
| − | | |
| − | # Plot a point
| |
| − | def plot(self,xp,yp,meta):
| |
| − |
| |
| − | # Convert from 'label' space to 'pixel' space
| |
| − | x = self.convertToPixel("X",xp)
| |
| − | y = self.convertToPixel("Y",yp)
| |
| − | | |
| − | if self.mark == "Oval":
| |
| − | oval = self.create_oval(x-self.mark_size,y-self.mark_size,x+self.mark_size,y+self.mark_size,width=1,outline="black",fill="SkyBlue2")
| |
| − | | |
| − | self.shapes[oval] = [x,y,0,xp,yp,meta]
| |
| − | | |
| − | | |
| − | # Repaint all points
| |
| − | def repaint(self):
| |
| − | for key,value in self.shapes.items():
| |
| − | x = value[0]
| |
| − | y = value[1]
| |
| − | self.create_oval(x-self.mark_size,y-self.mark_size,x+self.mark_size,y+self.mark_size,width=1,outline="black",fill="SkyBlue2")
| |
| − | | |
| − | # Convert from pixel space to label space
| |
| − | def convertToLabel(self,axis, value):
| |
| − | | |
| − | # Defaultly use X-axis info
| |
| − | label0 = self.xlabels[0]
| |
| − | label1 = self.xlabels[1]
| |
| − | spacing = self.spacingx
| |
| − | min = self.xmin
| |
| − | | |
| − | # Set info for Y-axis use
| |
| − | if axis == "Y":
| |
| − | label0 = self.ylabels[0]
| |
| − | label1 = self.ylabels[1]
| |
| − | spacing = self.spacingy
| |
| − | min = self.ymin
| |
| − | | |
| − | pixel = value - min
| |
| − | label = pixel / spacing
| |
| − | label = label0 + label * abs(label1 - label0)
| |
| − | | |
| − | if axis == "Y":
| |
| − | label = - label
| |
| − | | |
| − | return label
| |
| − | | |
| − | # Converts value from 'label' space to 'pixel' space
| |
| − | def convertToPixel(self,axis, value):
| |
| − | | |
| − | # Defaultly use X-axis info
| |
| − | label0 = self.xlabels[0]
| |
| − | label1 = self.xlabels[1]
| |
| − | spacing = self.spacingx
| |
| − | min = self.xmin
| |
| − | | |
| − | # Set info for Y-axis use
| |
| − | if axis == "Y":
| |
| − | label0 = self.ylabels[0]
| |
| − | label1 = self.ylabels[1]
| |
| − | spacing = self.spacingy
| |
| − | min = self.ymin
| |
| − | | |
| − | | |
| − | # Get axis increment in 'label' space
| |
| − | inc = abs(label1 - label0)
| |
| − | | |
| − | # 'Label' difference from value and smallest label (label0)
| |
| − | diff = float(value - label0)
| |
| − |
| |
| − | # Get whole number in 'label' space
| |
| − | whole = int(diff / inc)
| |
| − | | |
| − | # Get fraction number in 'label' space
| |
| − | part = float(float(diff/inc) - whole)
| |
| − | | |
| − | # Return 'pixel' position value
| |
| − | pixel = whole * spacing + part * spacing
| |
| − | | |
| − | # print "Pixel: %f * %f + %f * %f = %f" % (whole, spacing, part, spacing,pixel)
| |
| − | | |
| − | # Reverse number by subtracting total number of pixels - value pixels
| |
| − | if axis == "Y":
| |
| − | tot_label_diff = float(self.ylabels[len(self.ylabels)- 1] - label0)
| |
| − | tot_label_whole = int(tot_label_diff / inc)
| |
| − | tot_label_part = float(float(tot_label_diff / inc) - tot_label_whole)
| |
| − | tot_label_pix = tot_label_whole * spacing + tot_label_part *spacing
| |
| − | | |
| − | pixel = tot_label_pix - pixel
| |
| − | | |
| − | # Add min edge pixels
| |
| − | pixel = pixel + min
| |
| − |
| |
| − | return pixel
| |
| − | | |
| − |
| |
| − | # Print out which data point you just clicked on..
| |
| − | def pickWhich(self,event):
| |
| − |
| |
| − | # Find closest data point
| |
| − | x = event.widget.canvasx(event.x)
| |
| − | y = event.widget.canvasx(event.y)
| |
| − | spot = event.widget.find_closest(x,y)
| |
| − | | |
| − | # Print the shape's meta information corresponding with the shape that was picked
| |
| − | if self.shapes.has_key(spot[0]):
| |
| − | print "Residue(Ca): %s\n" % str(self.shapes[spot[0]][5][2])
| |
| − | | |
| − | | |
| − | # Mouse Down Event
| |
| − | def down(self,event):
| |
| − | | |
| − | # Store x,y position
| |
| − | self.lastx = event.x
| |
| − | self.lasty = event.y
| |
| − | | |
| − | # Find the currently selected item
| |
| − | x = event.widget.canvasx(event.x)
| |
| − | y = event.widget.canvasx(event.y)
| |
| − | self.item = event.widget.find_closest(x,y)
| |
| − |
| |
| − | # Identify that the mouse is down
| |
| − | self.down = 1
| |
| − | | |
| − | # Mouse Up Event
| |
| − | def up(self,event):
| |
| − | | |
| − | # Get label space version of x,y
| |
| − | labelx = self.convertToLabel("X",event.x)
| |
| − | labely = self.convertToLabel("Y",event.y)
| |
| − | | |
| − | # Convert new position into label space..
| |
| − | if self.shapes.has_key(self.item[0]):
| |
| − | self.shapes[self.item[0]][0] = event.x
| |
| − | self.shapes[self.item[0]][1] = event.y
| |
| − | self.shapes[self.item[0]][2] = 1
| |
| − | self.shapes[self.item[0]][3] = labelx
| |
| − | self.shapes[self.item[0]][4] = labely
| |
| − | | |
| − | # Reset Flags
| |
| − | self.item = (0,)
| |
| − | self.down = 0
| |
| − | | |
| − | | |
| − | # Mouse Drag(Move) Event
| |
| − | def drag(self,event):
| |
| − |
| |
| − | # Check that mouse is down and item clicked is a valid data point
| |
| − | if self.down and self.shapes.has_key(self.item[0]):
| |
| − |
| |
| − | self.move(self.item, event.x - self.lastx, event.y - self.lasty)
| |
| − | | |
| − | self.lastx = event.x
| |
| − | self.lasty = event.y
| |
| − | | |
| − | | |
| − | def __init__(self):
| |
| − | | |
| − | self.menuBar.addcascademenu('Plugin', 'PlotTools', 'Plot Tools',
| |
| − | label='Plot Tools')
| |
| − | self.menuBar.addmenuitem('PlotTools', 'command',
| |
| − | 'Launch Rama Plot',
| |
| − | label='Rama Plot',
| |
| − | command = lambda s=self: ramaplot())
| |
| − | | |
| − | | |
| − | def ramaplot(x=0,y=0,meta=[],clear=0):
| |
| − | global canvas
| |
| − | global init
| |
| − | | |
| − | # If no window is open
| |
| − | if init == 0:
| |
| − | rootframe=Tk()
| |
| − | rootframe.title(' Dynamic Angle Plotting ')
| |
| − | | |
| − | canvas = SimplePlot(rootframe,width=320,height=320)
| |
| − | canvas.bind("<Button-2>",canvas.pickWhich)
| |
| − | canvas.bind("<Button-3>",canvas.pickWhich)
| |
| − | canvas.bind("<ButtonPress-1>",canvas.down)
| |
| − | canvas.bind("<ButtonRelease-1>",canvas.up)
| |
| − | canvas.bind("<Motion>",canvas.drag)
| |
| − | canvas.pack(side=Tkinter.LEFT,fill="both",expand=1)
| |
| − | canvas.axis(xint=150,xlabels=[-180,-150,-120,-90,-60,-30,0,30,60,90,120,150,180],ylabels=[-180,-150,-120,-90,-60,-30,0,30,60,90,120,150,180])
| |
| − | canvas.update()
| |
| − | init = 1
| |
| − | else:
| |
| − | canvas.plot(int(x), int(y),meta)
| |
| − | | |
| − | | |
| − | # New Callback object, so that we can update the structure when phi,psi points are moved.
| |
| − | class DynoRamaObject:
| |
| − | global canvas
| |
| − | | |
| − | def start(self,sel):
| |
| − | | |
| − | # Get selection model
| |
| − | model = cmd.get_model(sel)
| |
| − | residues = ['dummy']
| |
| − | resnames = ['dummy']
| |
| − | phi = []
| |
| − | psi = []
| |
| − | dummy = []
| |
| − | i = 0
| |
| − | | |
| − | # Loop through each atom
| |
| − | for at in model.atom:
| |
| − | | |
| − | # Only plot once per residue
| |
| − | if not at.chain+":"+at.resn+":"+at.resi in residues:
| |
| − | residues.append(at.chain+":"+at.resn+":"+at.resi)
| |
| − | resnames.append(at.resn+at.resi)
| |
| − | dummy.append(i)
| |
| − | i += 1
| |
| − | | |
| − | # Check for a null chain id (some PDBs contain this)
| |
| − | unit_select = ""
| |
| − | if not at.chain == "":
| |
| − | unit_select = "chain "+str(at.chain)+" and "
| |
| − | | |
| − | # Define selections for residue i-1, i and i+1
| |
| − | residue_def = unit_select+'resi '+str(at.resi)
| |
| − | residue_def_prev = unit_select+'resi '+str(int(at.resi)-1)
| |
| − | residue_def_next = unit_select+'resi '+str(int(at.resi)+1)
| |
| − | | |
| − | try:
| |
| − | # Store phi,psi residue definitions to pass on to plot routine
| |
| − | phi_psi = [
| |
| − | # Phi angles
| |
| − | residue_def_prev+' and name C',
| |
| − | residue_def+' and name N',
| |
| − | residue_def+' and name CA',
| |
| − | residue_def+' and name C',
| |
| − | # Psi angles
| |
| − | residue_def+' and name N',
| |
| − | residue_def+' and name CA',
| |
| − | residue_def+' and name C',
| |
| − | residue_def_next+' and name N']
| |
| − | | |
| − | # Compute phi/psi angle
| |
| − | phi = cmd.get_dihedral(phi_psi[0],phi_psi[1],phi_psi[2],phi_psi[3])
| |
| − | psi = cmd.get_dihedral(phi_psi[4],phi_psi[5],phi_psi[6],phi_psi[7])
| |
| − |
| |
| − | print "Plotting Phi,Psi: "+str(phi)+","+str(psi)
| |
| − | ramaplot(phi,psi,meta=phi_psi)
| |
| − | except:
| |
| − | continue
| |
| − | | |
| − | | |
| − | def __call__(self):
| |
| − | | |
| − | # Loop through each item on plot to see if updated
| |
| − | for key,value in canvas.shapes.items():
| |
| − | dihedrals = value[5]
| |
| − | | |
| − | # Look for update flag...
| |
| − | if value[2]:
| |
| − | | |
| − | # Set residue's phi,psi to new values
| |
| − | print "Re-setting Phi,Psi: "+str(value[3])+","+str(value[4])
| |
| − | cmd.set_dihedral(dihedrals[0],dihedrals[1],dihedrals[2],dihedrals[3],value[3])
| |
| − | cmd.set_dihedral(dihedrals[4],dihedrals[5],dihedrals[6],dihedrals[7],value[4])
| |
| − | | |
| − | value[2] = 0
| |
| − | | |
| − |
| |
| − |
| |
| − | # The wrapper function, used to create the Ploting window and the PyMol callback object
| |
| − | def rama(sel):
| |
| − | rama = DynoRamaObject()
| |
| − | rama.start(sel)
| |
| − | cmd.load_callback(rama, "DynoRamaObject")
| |
| − | cmd.zoom("all")
| |
| − | | |
| − | | |
| − | # Extend these commands
| |
| − | cmd.extend('rama',rama)
| |
| − | cmd.extend('ramaplot',ramaplot)
| |
| | | | |
| | + | <source lang="python"> |
| | + | fetch 2x19, async=0 |
| | + | color yellow, chain A |
| | + | color forest, chain B |
| | + | rama polymer, none, ss, /tmp/canvasdump.ps |
| | + | rama ss H, none, aa, /tmp/canvasdump_helix.ps |
| | + | rama ss S, none, aa, /tmp/canvasdump_sheet.ps |
| | </source> | | </source> |
| − |
| |
| − | ===ADDITIONAL RESOURCES===
| |
| − |
| |
| − |
| |
| | | | |
| | [[Category:Script_Library|DynoPlot]] | | [[Category:Script_Library|DynoPlot]] |
| − |
| |
| | [[Category:Structural_Biology_Scripts|DynoPlot]] | | [[Category:Structural_Biology_Scripts|DynoPlot]] |
| | + | [[Category:Pymol-script-repo]] |